Download
1 / 24
240 likes | 430 Views
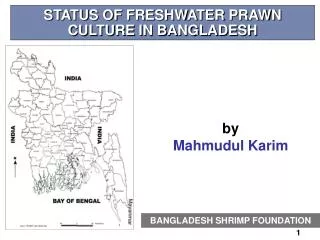
Spatial modelling of prawn (shrimp) abundance from large-scale marine surveys using penalised regression splines. Charis Burridge, Geoff Laslett (CMIS) & Rob Kenyon (CMAR) 30 November 2009. 0. 100. 200. 300. 400. Kilometers. Location of the fishery being surveyed.

E N D
Spatial modelling of prawn (shrimp) abundance from large-scale marine surveys using penalised regression splines Charis Burridge, Geoff Laslett (CMIS) & Rob Kenyon (CMAR) 30 November 2009
0 100 200 300 400 Kilometers Location of the fishery being surveyed Northern Prawn Fishery Great Barrier Reef Australia CSIRO Mathematical and Information Sciences
Introduction to the Northern Prawn Fishery (NPF) • Typical annual earnings > $100 million • ~40 yrs fishing, most in Gulf of Carpentaria • Measures taken to conserve multi-species stocks: (an input-controlled fishery up till now, i.e.control over number of vessels & gear type/size, also spatial and temporal closures) -- fleet size ~100 vessels in 2001, now ~50; -- NPF closed to fishing 7 months; -- coastline nursery areas closed all year • Apr-May mainly banana prawns (daytime allowed) • Sept-Nov mainly tiger & endeavour prawns (night only) CSIRO Mathematical and Information Sciences
Stock decline for tiger prawns ProjectedStock at 2001 management level Projected Stock at 2005 (25% gear cut) Stock Projected Stock at 2005 (95% CI) Projected Stock at 2005 (5% CI) 500 Brown tiger prawn (Penaeus esculentus) Grooved tiger prawn(Penaeus semisulcatus) 400 300 Sy/Smsy (%) 200 100 Management target Management target 0 1970 1980 1990 2000 2010 1970 1980 1990 2000 2010 CSIRO Mathematical and Information Sciences
NPF integrated prawn monitoring project • An international review by Rick Deriso in 2001 confirmed CSIRO advice that these species were over-exploited • He strongly recommended introducing fishery-independent surveys to augment the stock assessment process with unbiased indices of prawn abundance • The Northern Prawn Fishery Management Advisory Council funded a desktop study to scope up survey design options (Dichmont, Vance, Burridge et al; 2002) • Two surveys a year have been funded since Aug 2002 (initial cost AUD 500K per year; increased fuel & charter costs in recent years have pushed this up towards AUD 1M) CSIRO Mathematical and Information Sciences
Design considerations • Cost-effective: NPF fishers pay ~ full cost (now > $5000 per at-sea day, ~1 FTE staff [big team]) • Include 7 commercial prawn species • Timing of survey (month, moon phase, charter) • Sampling frame for spawning index -- based on spatial distribution of historical & current fishing effort Aug/Sep • Sampling frame for recruitment index -- based on well-known or inferred coastal/inshore nursery habitat + allowance for migration offshore • Hierarchical stratification – regional; sub-regional; depth; in order to-- improve precision by capturing large-scale spatial variation for 4 main commercial species; -- control spatial distribution of sampling effort over a very large area (300,000 sq.km. in Gulf of Carpentaria alone) CSIRO Mathematical and Information Sciences
Sampling frame for spawning survey (3 regions Jun/Jul/Aug): Groote, Vanderlins and Mornington; based on spatial distribution of historical & current fishing effort Aug/Sep CSIRO Mathematical and Information Sciences
Sampling frame for recruitment survey (5 regions Jan/Feb): (Groote, Vanderlins, Mornington, SEGulf & Weipa) based on known/inferred inshore nursery habitat + some offshore movement CSIRO Mathematical and Information Sciences
Aims of spatial smoothing of prawn density • Hitherto, we have reported a design-based relative abundance index for the whole survey area – essentially a weighted sum of the mean in each stratum • Now we want to capture more information about the spatial distribution of prawns in each survey • And prepare an index from this model-based approach • A Bayesian approach to the spatial modelling makes it easy to construct a credible (or “confidence”) interval for the index • The software called BayesX offers a useful suite of smoothing models implemented via a Markov Chain Monte Carlo approach • It’s also free CSIRO Mathematical and Information Sciences
BayesX website – note the recent update CSIRO Mathematical and Information Sciences
Spatial models for prawn abundance/density • 2-D penalised regression splines with 1st order random walk penalty • Basic concepts: • MCMC iterative approach aims to produce a large sample from the posterior distribution of the model coefficients (here with a diffuse Inverse Gamma prior on the variance); it is usual to discard the results of early iterations, so that start-up bias in the process is mimimised • Spatial domain is gridded and a set of 2-D spline ‘kernels’ set up so that the centre-point of each kernel sits on a grid intersection: these are the prediction variables in the model; log(prawn density) is the response variable • (Kernel) regression coefficients for a given iteration follow a 2-D 1st order random walk: coefficients of neighbouring kernels differ less than those of distant kernels (the smaller the variance of this random walk, the smoother the surface – prior can be a diffuse inverse Gamma) CSIRO Mathematical and Information Sciences
Publications on P-splines by BayesX team • Fahrmeir, L., Lang, S., 2001. Bayesian inference for generalized additive mixed models based on Markov random field priors. J. Roy. Statist. Soc. C 50, 201–220. • Lang, S., Brezger, A., 2004. Bayesian P-splines. J. Comput. Graphical Statist. 13, 183–212. • Brezger, A. & Lang, S., 2006. Generalized structured additive regression based on Bayesian P-splines.Computational Statistics & Data Analysis, 50, 967 – 991 CSIRO Mathematical and Information Sciences
Problem: lots of empty space & vast no. of parameters if want to capture fine-scale detail in regions where we do have data CSIRO Mathematical and Information Sciences
Solution: local coordinates for each region (PC scores from lat/lon of sites + frame); map all other regions to (0,0); simultaneously fit 6 sub-models => fewer knots, higher density CSIRO Mathematical and Information Sciences
Stability/convergence of North Groote variance – achieved after 15000 iterations (or so!) CSIRO Mathematical and Information Sciences
Checking for autocorrelation in parameters – achieved when keep 1 record in 60 (~20 minutes to run on my laptop) CSIRO Mathematical and Information Sciences
Observed brown tiger (P. esculentus) density in Jan/Feb CSIRO Mathematical and Information Sciences
Spatially smoothed brown tiger density – rare in Weipa, abundant around Mornington & improving CSIRO Mathematical and Information Sciences
95th %ile for smoothed brown tiger density CSIRO Mathematical and Information Sciences
Observed grooved tiger (P. semisulcatus) density in Jan/Feb CSIRO Mathematical and Information Sciences
Smoothed grooved tiger density – rare in SE Gulf and common in Weipa CSIRO Mathematical and Information Sciences
MCMC-based index (solid red & 90% credible interval) compared with design-based index (black diamonds & 90% mirror-match bootstrap confidence interval) for three species over 7 recruitment surveys CSIRO Mathematical and Information Sciences
Conclusions • A ‘toe in the water’ in terms of exploiting BayesX capabilities; BayesX authors have promptly responded to my requests and added extra functionality • BayesX can be used as a stand-alone package; I find it easier to import all BayesX results into R for graphical presentation – there is now an R package for this • Spatial smoothing has produced similar indices to the design-based approach, but appears less sensitive to occasional enormous catches (a benefit) • The spatial models reveal spatial contraction/expansion of the resource more directly than design-based indices • The design-based and model-based confidence/credible intervals differ substantially – to be investigated CSIRO Mathematical and Information Sciences
CMIS/EI Charis Burridge Research statistician Phone: +61 7 3826 7186 Email: charis.burridge@csiro.au Web: www.csiro.au/group Thank you Contact UsPhone: 1300 363 400 or +61 3 9545 2176Email: Enquiries@csiro.au Web: www.csiro.au