Download
1 / 23
230 likes | 468 Views
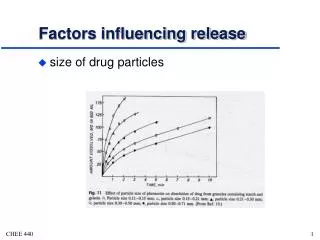
Analysis of Factors Influencing Travel Mode Choice in LA County. Presented by Runlin Cai, CAUPD Affiliate. Issue: What determines travel mode choice. Transit mode share in LA county was 3% in 2000. (Source: SCAG Year 2000 Post-Census Regional Travel Survey Report )

E N D
Analysis of Factors Influencing Travel Mode Choice in LA County Presented by Runlin Cai, CAUPD Affiliate
Issue: What determines travel mode choice • Transit mode share in LA county was 3% in 2000. (Source: SCAG Year 2000 Post-Census Regional Travel Survey Report) • There are numerous factors influencing travel mode choice, including socioeconomic, urban form, transport system, policy, etc. • My work is focusing on urban form and transport supply, especially difference between transit and roadway
Outline • Urban Form Factors • Travel Demand Side • Transport Supply Side • Travel Mode Choice • Conclusion
Range and Unit • Analysis Range: Los Angeles County • Analysis unit: Census Tracts
Urban Form Factors • Population: 9.8 million • Mean Density: 2,419/sq.miles
Transport Supply Side • Transit Network • 5 urban rail lines • Rapid lines • Local lines • Com circle lines
Transport Supply Side • Transit Network • 5.2 million population (53%) covered in 0.5 mile buffers
Transport Supply Side • Urban Rail Network • 5 urban rail lines • Mainly covered Downtown and southern area • Only 74 thousand people (7%) around 0.5 mile distance to rail stations
Transport Supply Side • Road Network • Freeways covering almost everywhere • 4.7 million population (48%) within 1 mile distance to freeway
Transport Supply Side • Vehicles used in Commuting • High car ownership and using, while relatively low near rail station area
Travel Demand Side • Trip-to-Work Density • High density along corridors • Trip-to-Work Time • Mostly over 20 minutes and more
Travel Mode Choice • Trip-to-Work Mode • Driving: most area exceeding 70% • The farther travel distance is, the more likely to choose driving • Due to the travel time cost
Travel Mode Choice • Trip-to-Work Mode • Public Transport: mostly lower than 5 percent • Areas near rail lines have higher transit share
Urban Rail Effect • Mode Share around Rail Stations • Overall daily boarding passengers up to 266,000 • Transit mode share much higher than other areas
Urban Rail Effect • Mode Share around Rail Stations • Average boardings # of every station exceeds 3,500 • Average transit share of nearby census track exceeds 13%
Different Effect in Transit and Freeway • Time Contour Comparison • In the same time period, travelers would reach 2 times wide area by driving as by transit
Example: Singapore • Public transit share up to 60% • Population density up to 15,000 persons/sq.mile • Most HDB apartments within 0.5mile to rail stations • Rail lines cover population of 50%
Conclusion based on factors analysis • Longer travel due to low density sprawling makes people prefer driving • Low level and insufficient transit network makes people unwilling to travel by transit • Urban rail transit would be better solution to attract travelers to take transit, and thus protecting environment and alleviating congestion
Skills Used • Map inset • Clip • Graduated symbol • Charts images • Geometry calculation • Creating indices • Spatial join • Field calculating & statistics • Merge • Attribute selection • Buffering of points and lines • Project define • Feature to lines • Network Analysis (service area) • Modeling