Download
1 / 19
190 likes | 332 Views
Regulatory effects on RNA polymerase. Binding constants Rate constants Measuring K B. Multiple steps in initiation and elongation by RNA polymerase are targets for regulation. RNA Polymerase has to * bind to promoters, * form an open complex, * initiate transcription,

E N D
Regulatory effects on RNA polymerase Binding constants Rate constants Measuring KB
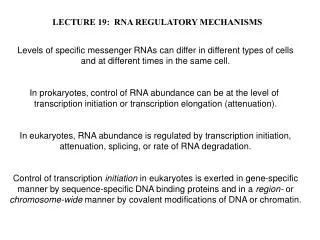
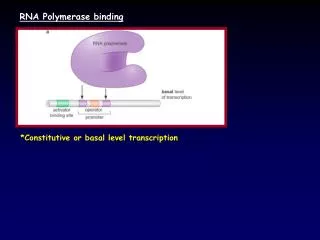
Multiple steps in initiation and elongation by RNA polymerase are targets for regulation RNA Polymerase has to * bind to promoters, * form an open complex, * initiate transcription, * escape from the promoter, * elongate * terminate transcription. All are potential targets for regulation.
Effects on KB, kf, kr Summarizing a lot of work, we know that: strong promoters have high KB, high kf, low kr, and high rates of promoter clearance. weak promoters have low KB, low kf, high kr, and low rates of promoter clearance. moderate promoters have one or more "weak" spots.
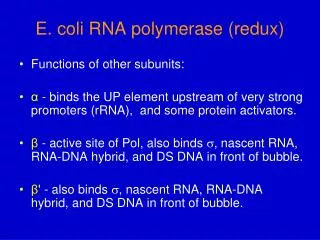
Activator binding site Promoter Operator TATAAT UV5 mutation, up TTTACA TATGTT -72 -52 -35 -10 +1 +11 a b b ' s Repressor cAMP-CAP RNA polymerase lac regulatory region
Synonymous and related terms KB = Kb = Keq = equilibrium constant for binding KS = KB for binding of protein to a specific DNA sequence KNS = KB for binding of protein to nonspecific DNA [P] = [P2] = molar concentration of protein [R4] = molar concentration of repressor [D] = molar concentration of free DNA [DS] = concentration of free specific DNA [DNS] = concentration of free nonspecific DNA [DP] = molar concentration of DNA-protein complex [R4DS] = concentration of repressor-operator
Techniques to measure amount of protein bound to DNA • Need: • Radioactively labeled DNA (usually a specific sequence) • Purified DNA-binding protein • Combine them and measure the amount of protein-DNA complex and free DNA by: • Electrophoretic mobility shift assays • DNase I footprinting • Retention of protein-DNA complexes on filters
[DP] KB = [D] [P] [DP] When =1, then [D] 1 KB = [P] Measure KB by EMSA [P] DP D + P 0 DP D
[DP] KB = [D] [P] [DP] When =1, then [D] 1 KB = [P] Measure KB from [DP]/[D] If you could measure [DP] and [D] at each [P], you could measure KB: DP D + P [DP] [D] [DP] 1.0 KB [P] = [D] [P] 1 KB slope = KB
[DP] [D]tot KB [P] 1 + KB [P] = 1.0 [DP] [D]tot 10 [P] 50 nM Measure KB from [DP]/[D]tot It is more reliable to measure the fraction of labeled DNA in complex with protein, i.e.[DP]/[D]tot Substitution of [D]=[D]tot - [DP] into equation for KB gives:
Protein binding assayed by DNase I footprinting Need to use many orders of magnitude of [P]. Fr. Dr. Tracy Nixon
What value for KB provides the best fit? • Classical methods: • Transform the data into a line • Or, e.g., at [DP]/[D]tot = 0.5, then KB=1/[P] • Problems: • Where to draw the line? • No accurate estimate of error • Nonlinear, least squares regression analysis = NLLS • A computer program calculates the goodness of fit for many values of KB, then one can choose the best fit (least error).
For a single protein binding to DNA (one site), the fractional occupancy, Y, is: Fractional occupancy from fractional probabilities Where j is the number of ligands bound, the fractional probability of a particular state is: and
[DP] [D]tot KB [P] 1 + KB [P] = Fractional occupancy in terms of KB DG = -RT ln (Keq) Since then Same as:
Data analysis by NLLS • After collecting binding data, one uses a nonlinear, least squares regression analysis to find the values of DG (or KB) that generate a function that best predicts the data. • Uses maximum likelihood theory to find the value most likely to be correct. • Produces plot of the variance of fit (or error) over a wide range of possible values for the parameter being measured, e.g. DG. • Reproducible by different investigators • Provides a rigorous estimate of error.
Variance of fit plotted vs. free energy The DG value with the smallest error is the most accurate.
ln KB = -DG/RT = -(-9.5 kcal/mol) = 16.1017 0.59 kcal/mol Example of calculating KB from plot of variance of fit vs. DG DG1= -9.5 kcal/mol gives the minimum variance (or error). DG = -RT ln (Keq) KB = 9.8 x 10 6 M -1 R = 1.98 x10⁻³ kcal deg-1 mol-1 T = 298° K RT= 0.59 kcal/mol