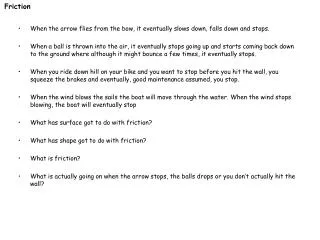
Static Friction
This study explores the impact of static friction, load torque, and temperature on robotic joints, particularly focusing on a comprehensive framework to understand their interdependencies. Utilizing the IRB 6620 robot's Joint 2, the research examines how friction changes with varying load torques and temperatures. Empirical models are proposed to accurately describe the relationships, including 11 parameters that account for temperature effects and static conditions. The findings aim to enhance the understanding of friction behavior, supporting better diagnostics and design evaluations for robotic systems.

Static Friction
E N D
Presentation Transcript
Static Friction Load torques and Temperature dependency
Motivation • What is the most common researched phenomenon in robotics? • Why?
Robots eventually break down Increase of wear debris Increase of friction However! Many other things affect friction Temperature Load Position Velocity/acceleration Lubricant, etc Motivation - Diagnosis
Objectives • How does friction changes with • Position • Load torques • Manipulated • Perpendicular • Temperature • Scope • IRB 6620 • Joint 2
Friction Curve Estimation • In steady-state one joint at a time • Average fwd and bwd movements • and use it as an estimate of the direction independent friction
Joint angles • 50 static curves • Angles range • 8.5 to 60º Effects • Not significant • M0 should do it
Perpendicular load torque • Tp range • [0.04, 0,10] • Small variations possible Effects • Not significant • At joint 1, small increase in Fs • For joint 2, M0 is enough
Manipulated Load Torque • 50 static curves • Tm range • [-0.7, 0,4] Effects • (linear) Fc increase • (linear) Fs increase • cte vs • Proposed model, M0 +2 terms
Temperature • 50 static curves (min/max) • T range • 34-80ºC Effects • (linear) Fs increase • (linear) vs increase • (exp-like) Fv increase • Load torque co-effects • Subtract surfaces • Subtract identified gravity terms from surfaces Independent!
Proposed Model • M0 + 4 terms • 7 terms (5 vel-weak, 2 vel-str) • Total of 11 parameters • Tm (3): • (linear) increase of Fc and Fs • T (4): • (linear) increase of Fs and vs • (exp) increase of Fv
Validation • Parameters identified with previous data • Error reduced by a factor of 6 M0:mean=0.027,max=0.071 M*:mean=0.004,max=0.018
Summary & Conclusions • Empirically motivated model to describe T and Tm • So far, 1 joint! • Tp might also affect • Tm affects vel-weak only (inc) • T affects vel-weak (dec) and vel-str (nonlinear inc) • 11 parameters (4nlin: 3 vs,TVo) • Id requires excitation over large range of T and Tm • Can T-params be directly related to lubricant props? • No T meas and Tm estimated* • Right now, more useful for design/evaluation • Can the model simply be plugged into a dynamic model (LuGre)?