Download
1 / 26
270 likes | 400 Views
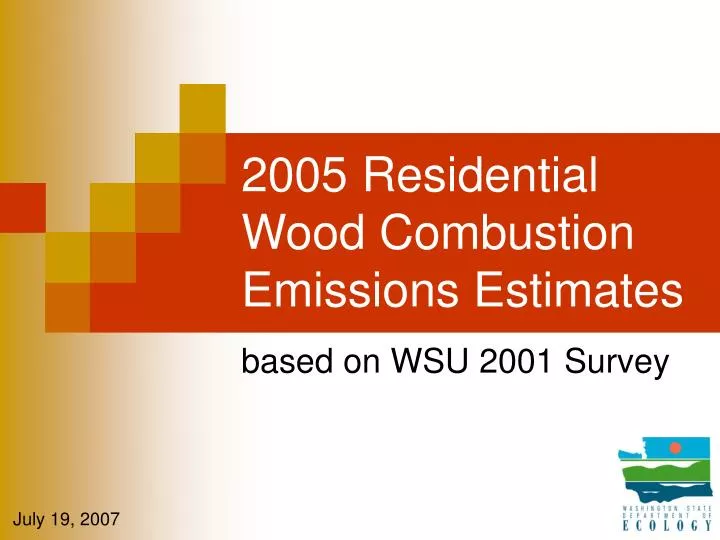
2005 Residential Wood Combustion Emissions Estimates. based on WSU 2001 Survey. July 19, 2007. Purpose of Survey: Update residential wood combustion emissions estimates. Last statewide survey was done by Bonneville Power Administration in 1990

E N D
2005 Residential Wood Combustion Emissions Estimates based on WSU 2001 Survey July 19, 2007
Purpose of Survey: Update residential wood combustion emissions estimates • Last statewide survey was done by Bonneville Power Administration in 1990 • Post-1990 woodstove sales indicated downward trend • 1990 – 2000 population growth ~ 21% • Current information wanted for air stagnation advisories, and air quality planning
Survey Partnership • Washington, Oregon, Idaho, and Canada were working together to develop regional emissions estimates for air quality analyses • Federal Environmental Protection Agency special project funding was available to states • WA/OR/ID combined EPA funding to make improvements to several emissions sources, including residential wood combustion
Survey • Social & Economic Sciences Research Center, Washington State University • John Tarni, Ph.D., principal investigator • Thom Allen, study director • Computer-assisted telephone interviews • Trained interviewers • Six call attempts, and individual scheduling • Interviewer monitoring • All responses were recorded. Database of coded responses was provided.
Survey Sampling * Purge removed all known non-working and non-household phone lines ** Incomplete included: refusals, unable to reach, non-working numbers, business numbers, unable to interview, FAX numbers, partial interviews
Survey Design • Questions designed to estimate • number of households owning and using wood-burning devices • amount of wood burned by device and certification status • geographic differences • seasonal, weekday/weekend, hourly variation • Drew upon 1990 BPA survey questions • Funding determined number of questions, sampling areas, and sample size
Questions – Devices Owned by Type • Do you have a … • fireplace without a stove insert? • fireplace with a stove insert? • free-standing woodstove? • pellet stove? • wood-fired central furnace? • Do you know when your stove or insert was purchased? (determines certification status) • year (month if known), or • approximately how old • If more than one device, which is used most for heating?
Questions - Devices Used by Type • Did you burn any cord wood last year? • Did you burn any presto logs last year? • Did you burn any wood pellets last year?
Questions – Amount of Wood Burned • How many cords did you burn last year? • cord is 4’ x 4’ x 8’ • How many presto logs did you burn last year? • How many 40-lb bags of wood pellets did you burn last year?
Supporting Data – Conversion to pounds burned
Supporting Data – PM2.5 Emission Rates in pounds per ton burned Certified INS and WS assumes split of 71% non-catalytic and 29% catalytic per the 2002 National Emissions Inventory (EPA).
Questions – Temporal Variation • Did you use this equipment in the … • winter, spring, summer, fall of 2000? (months were specified for each season) • During a typical weekday, did you use this equipment from … • 6am-10am, 10am-4pm, 4pm-10pm, 10pm-6am? • During a typical weekend, did you use this equipment from … • 6am-10am, 10am-4pm, 4pm-10pm, 10pm-6am?
Questions and Results – Heating Sources • What is your main source of heat?
Home Heating Statistics Sources • AHS04: 2004 America Housing Survey, Seattle-Everett Metro Area (http://www.census.gov/prod/2005pubs/h170-04-60.pdf) • CEN00: 2000 Census (http://www.census.gov/Press-Release/www/2002/demoprofiles.html) • WSU01: 2001 WSU Wood burning survey
Strengths activity based on local survey survey reduction process was checked by ODEQ number of devices similar to surveys done for PSCAA incorporated/unincorporated and east/west differences emissions factors were considered above average by EPA air quality modeling results not unreasonable (explain) Weaknesses survey generally did not ask questions in multiple ways (verification) required many steps to calculate emissions estimates from survey responses may somewhat overestimate cord wood use emission factors are based on testing done in late 1980s to 1990 inherent variability Observations on Estimates