Download
1 / 14
140 likes | 273 Views
A quick guide to The Z , t and two-sample t tests. We now have the following pieces. A probability density function that lets us estimate probabilities by looking at how far a point is from the mean. The idea of one- and two-tailed hypothesis tests.

E N D
We now have the following pieces • A probability density function that lets us estimate probabilities by looking at how far a point is from the mean. • The idea of one- and two-tailed hypothesis tests. • A method of standardizing data to have a mean of 0 and a standard deviation of 1. • The Central Limit Theorem, which gives us the standard deviation of the sample mean.
Let’s put them all together • I am interested in knowing if the mean of my sample is different from some population mean • First, take the idea of the standard transformation, which gives a data series with a mean of 0 and a standard deviation of 1.
Next add the Central Limit Theorem • Given the standard normal transformation, I need to have a value for the standard deviation of the standardization formula. • The Central Limit Theorem tells me that it will be
So… • This • Plus • Equals • Which is the Z test
To use the Z test • Look up the Z value and calculate the probability • Multiply by 2 if you are doing a two tailed test. • If the area (value of Z in table) is less than your alpha level(.05), then your Z is statistically significant. • You conclude that your sample mean is statistically significant from the population mean • You reject the null hypothesis
But what if you do not have the population Standard deviation () • Use the best estimate of it that you have. • the sample standard deviation (s). • This gives you the t-test • And for the t-test, we use a different table • the t-table
And what if we do not have a Population? • Then compare one sample to another, using the two sample t-test. • To do this, we substitute a sample mean for the population mean, but must use a different estimate of the standard deviation of the sampling distribution
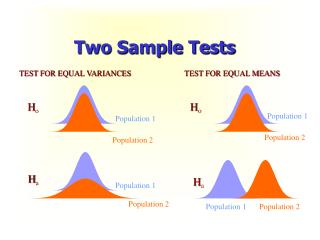
If we think the samples have different variances… • Use the unequal variance two sample t-test.
Degrees of Freedom • Because we are using a sample to estimate the population standard deviation, the effectiveness of our test is affected by the size of the sample • The t-test is adjusted according to the number of “degrees of freedom” • Which in the t-test context is equal to the sample size minus 1 (n-1).
If we think the samples have the same variance… • Use the equal variance two sample t-test. • Where
Degrees of Freedom for 2-sample tests • Note that the degrees of freedom is different across the two tests • Equal variance test • df= n1 +n2-2 • Unequal variance test • df= complicated – real number not integer
Which test to Use? • One of the fortunate properties on statistics is that the ratio of two variances will have an F distribution. • Thus with this knowledge, we can perform a simple test.
Interpretation of F-test • If we find that P(F) > .05, we conclude that the variances are equal. • If we find that P(F) .05, we conclude that the variances are unequal. • We then select the equal– or unequal-variance t-test accordingly.