Conducting a Two-Sample T-Test: Steps and Interpretations
This guide outlines the process of performing a two-sample t-test to compare means from two independent samples. It begins with defining parameters, such as means (μ1 and μ2) in context, and formulates hypotheses (H0 and HA). It details necessary assumptions like independence and normality while emphasizing the importance of not pooling data unless variances are assumed equal. The guide includes steps to calculate the test statistic, obtain the p-value, and make decisions regarding the null hypothesis, providing clear directions for sketching the t-distribution and shading appropriately.

Conducting a Two-Sample T-Test: Steps and Interpretations
E N D
Presentation Transcript
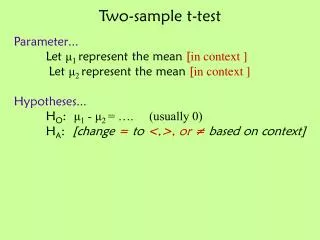
Two-sample t-test Parameter… Let μ1 represent the mean [in context ] Let μ2 represent the mean [in context ] Hypotheses… HO: μ1 - μ2 = …. (usually 0) HA: [change = to <,>, or ≠ based on context]
Two-sample t-test Assumptions/Conditions… 1. 2 Indep SRS / RAT 3. Nearly Normal? 2. 10% cond. [check for both groups! ] Name the test… Two-sample t-test
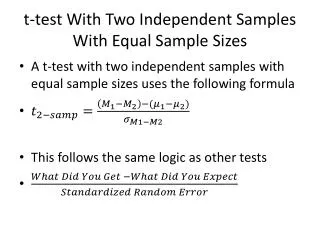
Two-sample t-test Test statistic… Find Find Obtain P-value… Sketch t-model and shade appropriately. To get df, use your calculator (STAT , TESTS, 2-SampTTest)
Two-sample t-test Make a decision… Since P-value (…) is [less / greater] than α(…) I will [reject / fail to reject] the Ho State a conclusion IN CONTEXT!… There [is / is not] sufficient evidence to suggest that…[Ha in context]
To “pool” or not to “pool”? Don’t pool. When you do this on the calculator, it will ask you if you want to ‘pool’ the data…. JUST SAY ‘NO’ ! “Pooling” in this case would indicate that you think the populations have equal variances.