Causal Concepts
220 likes | 537 Views
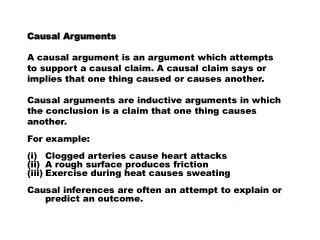
Causal Concepts. Natural History of Disease. Progression of disease in individual over time. Natural History of HIV/AIDS. Identify stages: Susceptibility Incubation Clinical. Rothman on Cause. Definition of “cause” Any event, act, or condition preceding disease or illness

Causal Concepts
E N D
Presentation Transcript
Natural History of Disease Progression of disease in individual over time Chapter 2
Natural History of HIV/AIDS Identify stages: Susceptibility Incubation Clinical
Rothman on Cause Definition of “cause” • Any event, act, or condition • preceding disease or illness • without which disease would not have occurred • or would have occurred at a later time Disease results from the cumulative effects of multiple causes acting together (causalinteraction) Ken Rothman (contemporary epidemiologist)
Types of Causes (Causal Pies) A given disease can have multiple sufficient mechanisms • Necessary cause ≡ found in all cases • Contributing cause ≡needed in some cases • Sufficient cause ≡the constellation of necessary & contributing causes that make disease inevitable in an individual
Causal Complement(Causal Pie) Causal complement ≡ the set of factors that completes a sufficient causal mechanism Example: tuberculosis Necessary agent Mycobacterium tuberculosis Causal complement“Susceptibility” 6
Epidemiological Iceberg & Spectrum of Illness • When looking for population occurrence, only the tip of the iceberg is visible • “Dog bite” iceberg • 3.73 million dog bites annually • 451,000 medically treated • 334,000 emergency room visits • 13,360 hospitalizations • 20 deaths
Iceberg & Spectrum Spectrum of illness ≡ most diseases demonstrate a range of manifestations and severities Example: Polio 95%: subclinical 4%: flu-like 1%: paralysis clinical subclinical 8
Causal Web Causal factors act in a hierarchal web Chapter 2
Epidemiologic Triad Agent, host, and environmental interaction
Types of Host Factors • Physiological • Anatomical • Genetic • Behavioral • Occupational • Constitutional • Cultural • etc!
Types of Environmental Factors • Physical, chemical, biological • Social, political, economic • Population density • Cultural • Env factors that affect presence and levels of agents
A H A H E E H A The proportion of susceptibles in population decreases Agent becomes more pathogenic E At equilibrium Steady rate A H E E H A Environmental changes that favor the host Environmental changes that favor the agent Homeostatic Balance
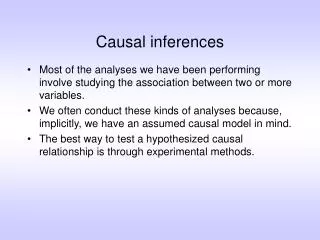
Descriptive Epidemiology I keep six honest serving men They taught me all I know; Their names are what and why and when And how and where and who. (Kipling) Exploration of rates by • person variables • place variables • time variables
“Rate” Loosely, the “rate” of an event is the number of events divided by population size
Rates Expressed with Population Multiplier • Let m≡ population multiplier • Simply multiply by m and say “per m” • Example 1: The rate of .00933 expressed “per 1000” is .00933 × 1000 = 9.33 per 1000 • Example 2: The rate of .00933 expressed “per 100,000” is .00933 × 100,000 = 933 per 100,000
Person Variables • Characteristics, attributes, and behaviors of individuals • Examples of person variable: • Illustration: Recreational injuries per 1000 person-years by age and gender
Place Variables • Where people live and work • Examples: see • Illustration: Age-adjusted breast cancer mortality in 23 countries, 1958–59
Time Variables • Examples of time variables • Example: Epidemic curves • Sporadic • Endemic • Point epidemic • Propagating epidemic