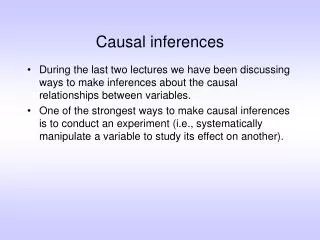
Causal inferences
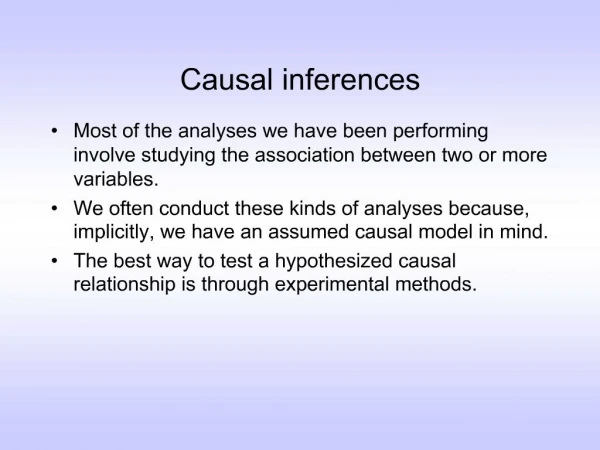
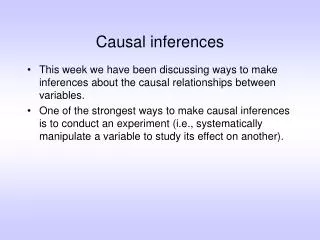
Causal inferences. Most of the analyses we have been performing involve studying the association between two or more variables. We often conduct these kinds of analyses because, implicitly, we have an assumed causal model in mind.

Causal inferences
E N D
Presentation Transcript
Causal inferences • Most of the analyses we have been performing involve studying the association between two or more variables. • We often conduct these kinds of analyses because, implicitly, we have an assumed causal model in mind. • The best way to test a hypothesized causal relationship is through experimental methods.
Causal inferences • Unfortunately, we cannot experimentally study a lot of the important questions in personality for practical or ethical reasons. • For example, if we’re interested in how a person’s prior history in close relationships might influence his or her future relationships, we can’t use an experimental design to manipulate the kinds of relational experiences that he or she had.
Causal inferences • How can we make inferences about causality in these circumstances? • There is no fool-proof way of doing so, but today one kind of tool that is commonly used: partial correlation methods.
Statistical Control • The biggest problem with inferring causality from correlations is the third variable problem. For any relationship we may study in psychology, there are a number of confounding variables that may interfere with our ability to make the correct causal inference.
Statistical Control • Stanovich, a psychologist, has described an interesting example involving public versus private schools. • It has been established empirically that children attending private schools perform better on standardized tests than children attending public schools. • Many people believe that sending children to private schools will help increase test scores.
Statistical Control • One of the problems with this inference is that there are other variables that could influence both the kind of school a kid attends and his or her test scores. • For example, the financial status of the family is a possible confound. “quality” of school test scores + + financial status
Statistical control • One commonly used method for controlling possible confounds involves statistical techniques, such as multiple regressionandpartial correlation. • In this we statistically control for the potential effects of the confounding variable to see how this impacts the correlation between the variables of interest.
Statistical control • If you know the correlations among three variables (e.g, X, Y, and Z), you can compute a partial correlation, rYZ.X. A partial correlation characterizes the correlation between two variables (e.g., Y and Z) after statistically removing their association with a third variable (e.g., X).
Statistical control • If this diagram represents the “true” state of affairs, then here are correlations we would expect between these three variables: Y Z “quality” of school test scores .5 .5 financial status • We expect Y and Z to correlate about .25 even though one doesn’t cause the other. X
Statistical control Y Z “quality” of school test scores .5 .5 financial status • The partial correlation between Y and Z is 0, suggesting that there is no relationship between these two variables once we control for the confound. X
Statistical control • What happens if we assume that quality of school does influence student test scores? • Here is the implied correlation matrix for this model: Y Z .5 “quality” of school test scores .5 .5 financial status X
Statistical control Y Z .5 “quality” of school test scores .5 .5 financial status • The partial correlation is .65, suggesting that there is still an association between Y and Z after controlling X. X
Statistical control • Statistical control is not a foolproof method. If there are confounding variables that have not been measured, these unmeasured variables can produce a correlation between two variables. • In short, if one is interested in making causal inferences about the relationship between two variables in a non-experimental context, it is wise to try to statistically control possible confounding variables.
Partial Correlations in SPSS • In the “Analyze” menu, choose “correlate” and then “partial.” • A new window will appear. Select the variables of interest and shoot them over to the “Variables” box. • Select the variable you want to control for and shoot it over to the “Controlling for” box. • Click the “Ok” button to run the analysis.
The output shows a correlation table based on partial correlation methods. Notice that in this example, the partial correlation between school quality and test scores virtually disappears when family financial status is statistically controlled.
How would you write up these kinds of results? • Table 1 shows the correlations among the quality of school attended, test scores, and family financial status. As can be seen, children attending better schools tended to have higher test scores (r = .29). However, both variables also correlated positively with family financial status. To determine whether the correlation between school quality and test scores still held once controlling for family financial status, we conducted a partial correlation analysis. The partial correlation between school quality and test scores virtually disappeared (r = .04) once we controlled for family financial status. Taken together, these findings suggest that the relationship between school quality and performance is due to the shared effects of family financial status. In other words, it does not appear that good schools necessarily produce good students once the potential confound of family financial status is taken into account.