Download
1 / 33
330 likes | 491 Views
HIGH-LEVEL PROJECTIONS FOR EDUCATION (HIPE). A Resource Planning Tool for Effective Policy Makers. Collaborative Africa Budget Reform Initiative meeting Accra, Ghana February 25-27, 2013. FHI 360 GLOBAL LEARNING GROUP.

E N D
HIGH-LEVEL PROJECTIONS FOR EDUCATION (HIPE) A Resource Planning Tool for Effective Policy Makers Collaborative Africa Budget Reform Initiative meeting Accra, Ghana February 25-27, 2013
FHI 360 GLOBAL LEARNING GROUP • FHI 360 is a nonprofit human development organization advancing integrated, locally driven solutions in health, education, nutrition, environment, economic development, civil society, gender equality, youth, research and technology • FHI 360 serves more than 60 countries • FHI 360 Global Learning Group programsemphasize the use of data for decision making and foster student-centered learning in fragile and post-conflict areas.
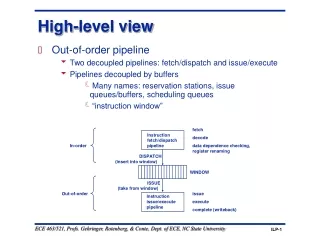
Introduction • Projections are a management and planning tool for researchers and policy makers in different fields • Demography • Environment • Finance • Health • Education • Projections in education are used to set expectations of pupil enrollment and resource needs within an area of interest
EPDC projections • FHI 360 EPDC projections expertise • Education trend projections for multilateral and bilateral agencies (USAID, UNESCO, UNICEF, AusAID, GPE) • Target-driven projections for local governments and education authorities (Pakistan, Namibia) • Each set of projections has its rationale and assumptions • Projections are only as good as the baseline data and the realism of the assumptions that drive them
Stage 1: Pupil enrollment projections • Use available current and historical pupil enrollment data • Apply known or target rates of new intake, repetition, and dropout, to model the flow of cohorts and calculate total number of pupils in each grade • Disaggregate by geographic area, level of education, gender, etc • Use pupil/teacher ratio, pupil/ classroom ratio, pupil/ textbook ratio data to estimate total need for teachers and classrooms
EPDC projections: the Cohort method • EPDC employs the Cohort method, where pupils are traced through a time series, starting from latest historical year • Intake, repetition and dropout rates are applied to the available population and pupil data to model cohort movement Grade 3 Students, Year 3 Grade 2 Students, Year 2 Grade 1 Students, Year 1 New entrants, Year 0
General principles • Projections of pupil enrollment are driven by a set of manipulable parameters: • Gross intake rate (i.e. proportion of pupils in Grade 1 over the population of starting age) • Repetition rates, by grade and gender if possible • Dropout rates, by grade and gender if possible • Pupil-teacher, pupil-classroom, pupil textbook ratios • Training costs, if available • Therefore, the assumptions about the expected change in these key indicators determines the outcome, in terms of pupil enrollment
Constant method: Fix the parameter at most recent available historical value
Pupil projections • Once the driver parameter assumptions are set: • For each year in the projection period (e.g. 2012-2020), a value for GIR and flow rates is calculated • The resulting value for each year is applied towards relevant population and pupil data to obtain a projection of pupils
Pupil cohort projections in a nutshell Grade 1 projection = New entrants + Repeaters in G1 • New entrants = Gross intake rate * Relevant population • Repeaters = Repetition rate * Relevant Enrollment in G1 Grade 2 projection= Promoted pupils+ Repeaters in G2 • Promotion= Enrollment from G1, minus repetition (those who stay in G1), minus dropout (those who leave the system permanently) • Repeaters = Repetition rate * Relevant Enrollment in G2 Grade 3 and above:Same method as for Grade 2 (promotion from previous grade + repetition from same grade)
Stage 2: Cost projections • Enrollment projections are transformed into projections of resource needs: • Teachers: total enrollment / pupil-teacher ratio (PTR) • New teacher need is estimated as the difference between existing teacher force and total teacher need • Teachers to be trained (if available, based on proportion of teachers known to be untrained) • Classrooms: total enrollment / pupil classroom ratio • Textbooks: total enrollment / pupil textbook ratio • Unit costs are then applied to convert resource needs into anticipated expenditures
Costing it out: Teacher salaries = Projected Teachers X Annual teacher salary (can be set as target or kept constant ) Teacher salary cost teacher salary
Costing it out: Teacher training costs (South Sudan HIPE module only) Teacher training need = % Trained teachers X Total teachers projected Training may be disaggregated by type of training: in-service or pre-service, set by the user (in-service may be higher cost)
Costing it out: Teacher training cost Cost of pre-service training Cost of in-service training X Proportion of teachers that need training
Costing it out: Classroom costs • Classroom costs consist of: • New classroom construction cost • Classroom maintenance cost (usually a percentage of construction cost) • Total classroom need = Enrollment / PCR • New construction need = Total need – Existing classrooms • All existing classrooms should be included in maintenance costs
Costing it out: Classroom costs • Classroom construction may be further broken down by type of classroom: permanent, semi-permanent, or other, as in this example:
Costing it out: Classroom costs • Even as the total number of classrooms needed decreases in South Sudan, the new classroom building costs increase as the Ministry aims to build more permanent classrooms
Costing it out: Textbook costs • Total textbook costs can be set by the user – held constant, or vary across future years Textbook cost = Textbook need X Cost per textbook
Costing it out: Textbook costs • In the South Sudan HIPE model, textbook costs were projected separately for English, Math, and other subjects, based on target costs set for future years
Costing it out: Total expenditure and gap estimation • Combine all costs: • teacher salary costs • teacher training costs (if estimated) • classroom construction and maintenance costs • textbook costs • Add other recurrent cost projection (set as % of salaries, or broken out by individual line items) • IF IMPORTANT: Separate out PUBLIC expenditure • Project budget availability • Education budget as % of total government budget, by level (primary and secondary)
Flexibility and richness of HIPE projection modeling • Can be adapted to any context and scenario • Is flexible and driven by user-set parameters, which can be either aspirational (target) or trend-based • Can span multiple national and subnational units: • For South Sudan, the national model combines several state-specific modules, each with state-level data and projections • A model developed for Pakistan develops projections within one province, at the district level • A model for UNESCO and GPE spans across multiple countries
THANK YOU More information is available upon request: epdc@fhi360.org Carina Omoeva, Ph.D. Education Policy and Data Center • Global Learning Group • FHI 360