Download
1 / 33
330 likes | 428 Views
GG 450 Lecture 3 1/22/08 . Gravity Corrections Potential Geoid. Recall from last class:

E N D
GG 450 Lecture 31/22/08 Gravity Corrections Potential Geoid
Recall from last class: • We obtain gravity readings from gravimeters, the readings are corrected to milligals by a calibration constant, and to observed gravity by comparing our data to a known value. The result is OBSERVED g: gobs • The value of gravitational acceleration varies in a predictable way with latitude, being about 5,000 mgals higher at the poles than at the equator. We correct for this using an empirical formula. The gravity anomaly is the observed value - the model value.
I have a philosophical argument with the book at this point. A scientist should not "correct" data (gobs), but should correct the model. Your book talks about making corrections to the data, while I will talk about making the model more complete, and thus reducing the errors, or variance, between the data and the model. Mathematically, there is no difference. Philosophically, there is a big difference. YOU SHOULD FIX YOUR MODEL, NOT YOUR DATA
Table 6.1 shows how gravity changes with latitude. This is an interactive table that is included in the book's CD. You can change the parameters and see their effect on the gravity model and on the accuracy required of measurements. Where are position accuracy requirements more severe, near the poles or near the equator?
Recall what it is that we are trying to determine: Gravity will change with changes in the density of the material near the gravity meter. We want to know what the unknown density variations are likely to be. We already have a model - given by the gravity formula and based on the shape of the earth and the earth's rotation, if necessary, we can also change the model to correct for tides and the motion of our meter over the surface (Eotvos). Our model for a gravity reading assumes that the reading is taken at sea level at a particular latitude. How can we change the model to better mimic our data?
First, we seldom take gravity levels at sea level, and the change in gravity with elevation can be modeled. At the radius of the earth, the change is 0.3086 mgal/m
0.3086 mgal/m is the "free air" constant. If you multiply the free air constant by the elevation of the gravity station (positive upwards, in meters), you can correct your model to the elevation of the station. This correction is called the free air correction, FAC. FAC=0.3086 (mgal/m) * elevation (m) Now our model can be written: model = gn-FAC Thus we can now calculate the Free Air Anomaly: FAA=gobs-[model]= gobs-[gn-FAC] The free air anomaly is the anomalous gravity acceleration when a model value that includes the elevation of the station is subtracted from the observed value.
Rather than remember whether the FAC is positive or negative, remember this: as elevation goes up, gravity decreases. Many surveys stop with the FAA, since that anomaly may be the only one that can be accurately estimated. The FAC only corrects our model for the station elevation - it does not include the MASS of material between us and the datum (usually sea level). Sometimes we know much about the density of the material around us, and we can correct our model for it. For example, when we take gravity readings at sea, our FAC is a constant, depending on the elevation of the meter in the ship, but we know the density of sea water, and it is relatively easy to include the ocean in our model if we know the ocean depth.
We now want to have our model account for the material between the station and the datum. To do this we assume that there is an infinite slab of material between the station and the datum. While this is often a poor assumption, it is heavily used, and the resulting correction is called the Bouguer Correction.
Infinite slab We want to calculate the attraction of the salmon-colored slab above for the Bouguer correction at Station A. Your book derives the formula for the Bouguer correction: BC=2pGrdz 6.24 Where dz is the thickness of the slab.
An interesting observation is that the attraction of this slab does not depend on how far it is from the gravimeter - only on its thickness. Make sense? The value of the Bouguer correction depends on the density assumed for the material. Many times, a density of 2.67g/cm3 is assumed, but any value can be used if prior knowledge is there. Not assuming density, the value of the FAC is: BC=0.04193(z) mgal/m, with density in gm/cm3 Note that the BC is about 3 times the FAC for reasonable densities. Check Table 6.2 for relative values of the FAC and BC.
The Bouguer anomaly is then: BA=gobs-[model] = gobs-[gn-FAC+BC] Notice that if your station is in a valley BELOW the datum, then mass is MISSING between the station and the datum. To correct the model. the mass must be removed from the model.
Often, the Bouguer correction is a poor model - particularly when there are nearby elevation changes, or changes in the ocean depth. A more complete model includes changes in the terrain near the station, called terrain corrections. Your book goes into some detail on the tedious and boring methods commonly used before good DEMs became available. With good digital elevation models, software can be used that makes the corrections for terrain changes in either 2 or 3-dimensional models.
Notice that these terrain corrections are adding mass above the station when elevation is above the station, or subtracting mass if elevation is below the station. The resulting effect is to DECREASE the model gravity in both cases.
HOMEWORK DUE: The large variation from the equator to the poles requires that we remove this expected variation from gravity data before we can see changes caused by local mass variations. This change is ~1.1 mGal/km at our latitude.
Lab comment- I don’t care as much about the answers as I do about how you got them. I need to see your Excel files or Matlab m-files as appropriate. Use comments in any files you give me. Explain what you did. Repeat the question in your answer. If an answer looks like it’s wrong, it probably is. If you get obviously wrong answers, I want you to recognize that they’re wrong. Put your name on each page you hand in. File names should contain at least your initials and the due date.
GRAVITY POTENTIAL One of the most powerful tools in gravity analysis is the gravity potential. While the acceleration is a vector field where the effects of all masses must be calculated by 3-d vector addition, the potential is a scalar field whose value at any point depends only on the masses and distances to all bodies considered.
To obtain the gravitational acceleration at any point, all you need to do is calculate the gradient of the potential. The acceleration in any particular direction is the derivative of the potential in that direction. Thus, we can sum up all the effects of the bodies of interest and then take the derivative in the 'vertical' direction to obtain the gravity anomaly caused by those bodies that would be measured by a gravimeter. So, what IS the potential? For a POINT MASS:
The gravitational acceleration is then the gradient of the potential, or: If we only care about the acceleration in the 'vertical' direction - which is the case for gravity measurements taken at the surface of the earth - then What makes this so interesting is that these values are easy to calculate in Matlab, and the effects of each mass are independent of all other masses, so we can easily add and remove masses to generate models without having to worry about the directions to those masses.
Consider the gravity field generated (in 2 dimensions) by three point masses: %% gravpot %% gravity potential % calculates 3-body potential and calculates the gradient in two dimensions clear all % mass values and locations: pointmass=[150000 30000 30000];% masses of bodies xy=[63.3 22.2; 13.3 33.6; 77.2 63.2]; % calculate potentials on 10x10 grid pot=zeros(100,100); %100x100 grid X=[1:100]; Y=X;
for ii=1:100 I=ii; % available for scaling for jj=1:100 J=jj; % available for scaling for kk=1:3 % calculate distance from mass to test point r=sqrt((xy(kk,1)-I)^2+(xy(kk,2)J)^2); % calculate potential (ommiting G for ease) pot(ii,jj)=pot(ii,jj)+pointmass(kk)/r; end end end potlog=log10(pot); % get log of potential for contours contour(X,Y,potlog,20) % potential contour plot
These contours show lines of equal potential from three point masses. They are called equipotentials. Whenever you move along an equipotential, you do no work. A ball rolling along an equipotential will not accelerate. The “up” direction is perpendicular to the equipotential lines. Why plot the log of the potential?
The following commands calculate the gradient and plot directions for the gradient: hold on [accelx accely]=gradient(pot,10000); % get gradient of the potential % go through next loop to normalize for constant-length arrows for ii=1:100; for jj=1:100; atn=atan2(accely(ii,jj),accelx(ii,jj)); accely(ii,jj)=sin(atn); accelx(ii,jj)=cos(atn); end end quiver(X,Y,accelx,accely,.5); % plot directions of acceleration axis equal
The arrows show the directions of acceleration at each point on a grid. Note the “zero” point between the two masses.
The GEOID: The geoid is the shape of the earth's surface defined by an equipotential surface - or a surface where the gravity potential is a constant. On earth, sea level closely approximates the geoid. What will happen to sea level above a big hole in the ocean? Until recently, the shape of the geoid was unknown and extremely difficult to measure, since the direction "up" is defined to be perpendicular to the geoid, it is difficult to measure the geoid topography - much like it was difficult to figure out that the earth isn't flat.
Satellites are strongly affected by gravity, and small changes in their orbits are used to show changes in the geoid.
Short wavelength geoid undulations reflect ocean depths and tectonic variations, while the source of some of the very long wavelength undulations are more likely related to undulations in the core-mantle boundary.
It is often easy to obtain a good estimate of the vertical component of gravity by obtaining the difference in potential between two points separated by a small vertical distance: See "Gravity Above a Sphere" Excel file for g calculated directly and using potential. This method works particularly well for calculating anomalies from large numbers of discrete bodies or shapes.
Gravity of the earth and planets The geoid gives us the shape that the oceans would take if the earth were covered by water. The geoid is an equipotential surface. Changes in this shape from the equilibrium oblate spheroid imply that the density of materials below is variable. High densities below cause a bulge in the geoid and low densities cause a low in the geoid. This is because the mass of the water is attracted to the regions where large mass is near.
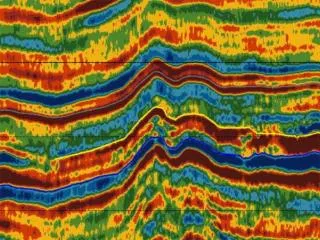
This is the geoid near Hawaii. It has a range of over 30 meters and it reflects the topography. Data Max value : 27.7 meters Data Min value : -3.1 meters