Download
1 / 36
360 likes | 380 Views
Explore patterns in student transcripts, analyze levels of achievement, and derive implications for science teaching in environmental literacy.

E N D
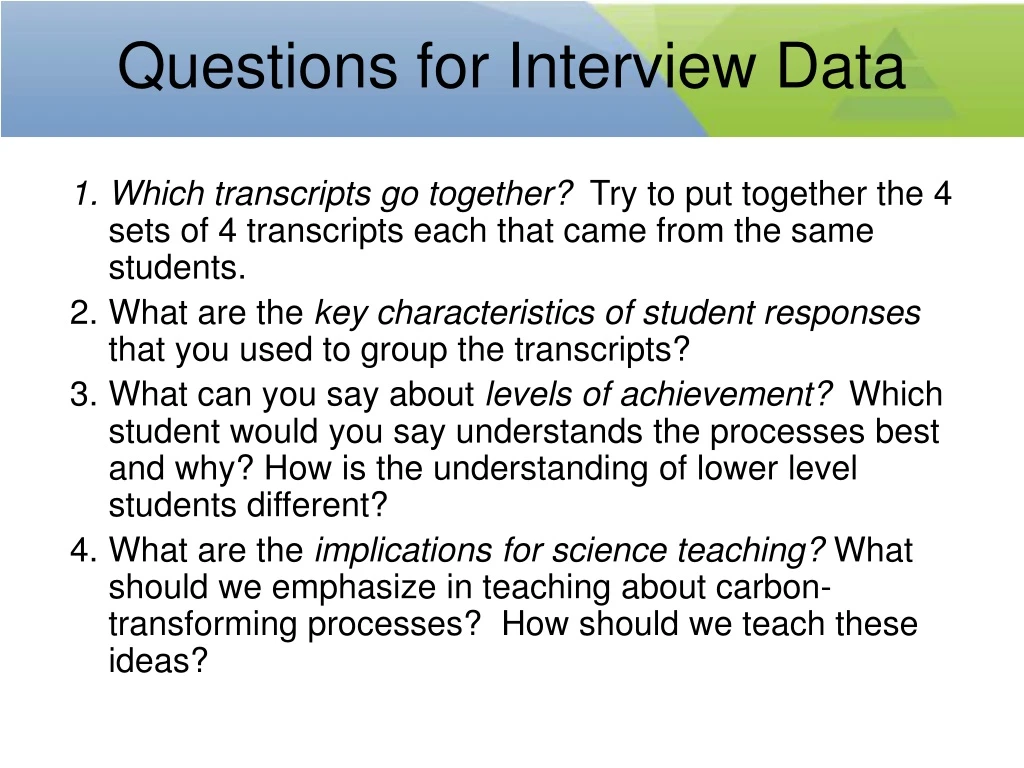
Questions for Interview Data 1. Which transcripts go together? Try to put together the 4 sets of 4 transcripts each that came from the same students. 2. What are the key characteristics of student responses that you used to group the transcripts? 3. What can you say about levels of achievement?Which student would you say understands the processes best and why? How is the understanding of lower level students different? 4. What are the implications for science teaching? What should we emphasize in teaching about carbon-transforming processes? How should we teach these ideas?
Notes about Interview Data 1. Which transcripts go together?There are patterns that DO connect responses across questions. Students show consistent ways of approaching different phenomena. 2. What are the key characteristics of student responses that you used to group the transcripts? This is a challenge for our research project. We have to identify and describe key characteristics of student thought and language. 3. What can you say about levels of achievement?This follows from #2. We are trying to develop learning progressions. 4. What are the implications for science teaching? This follows from #3.
Learning Progressions in Environmental Science Literacy Presented at the CRCSTL Seminar October, 2007 Andy Anderson
Important Contributors • Lindsey Mohan, Chris Wilson, Beth Covitt, Kristin Gunckel, Blakely Tsurusaki, Hui Jin, Jing Chen, Hasan Abdel-Kareem, Rebecca Dudek, Josephine Zesaguli, Hsin-Yuan Chen, Brook Wilke, Ed Smith, Jim Gallagher, and Edna Tan at Michigan State University • Mark Wilson, Karen Draney, Jinnie Choi, and Yong-Sang Lee at the University of California, Berkeley.
Environmental Science Literacy • The capacity to understand and participate in evidence-based discussions of socio-ecological systems. • What scientific knowledge and practices should all students learn that will give them the capacity to be environmentally responsible citizens?
LTER Socio-Ecological Research Collins et al. 2007. ISSE.
Environmental Literacy “Loop” Diagram Current Science Curriculum
Implications for Science Curriculum • Thinking about any of the issues in the loop requires “completing the loop” • Our current curriculum is fragmented and inside the environmental systems box • We need to teach what’s inside the box in ways that enable students to connect to the arrows
Practices (all involve “completing the loop”) • Inquiry: learning from experience • Accounts: using scientific knowledge to explain and predict • Citizenship: making environmentally responsible decisions • Private roles: learner, consumer, worker • Public roles: voter, volunteer, advocate
Strands (Handout Table 1) • Carbon: foods and fuels, global climate change, processes that produce, transform, and oxidize organic carbon • Water: fresh water, water management, processes that move and distribute water, processes that alter water composition • Biodiversity: foods and land for living, settlement and management for production, processes that create, sustain, and reduce biodiversity
What have we learned about how current students engage in these practices? Focus for this session: Accounts of processes in the carbon strand.
Carbon (Handout Table 2) Unit of Analysis: Processes in Environmental SystemsEvents We Have Asked About (Macroscopic Scale) • Plant growth, plants’ need for sunlight, plant gas exchange (generation of organic carbon) • Plant and animal growth, digestion, food webs (transformation of organic carbon) • Exercise by animals, weight loss, decay (oxidation by cellular respiration) • Burning wood and candles, moving cars, appliances (oxidation by combustion) • Grandma Johnson, Amazon tree growth (multiple processes)
Learning Progressions • Many standards and curricula contain too many disconnected topics that are given equal priority. Too little attention is given to how students’ understanding of a topic can be supported and enhanced from grade to grade. As a result, topics receive repeated, shallow coverage with little consistency, which provides fragile foundation for further knowledge or growth. Taking Science to School (National Academy of Sciences, 2007) • Learning progressions describe the complicated ways in which students reason about content over broad periods of time. • Incorporating how students reason about topics over time will improve the quality of ecological education, helping us establish curricula and standards that lead to ecological literacy
Levels of Achievement in Carbon Learning Progression We use seven levels of achievement to map out students’ progress (See Handout Tables 2, 4, 5): Levels 1-3: Stories about events. Students make sense of the world by telling stories about events that they see and hear, with little awareness of systems or hidden mechanisms Level 4: School science narratives. Students include atoms, molecules, and large-scale systems in their stories, but they cannot use scientific models and principles to “complete the socio-ecological loop” Levels 5-7: Model-based reasoning about socio-ecological systems. Students use scientific models and principles to complete the loop, connecting human social and economic systems and issues with environmental systems and issues.
Carbon Level 5 Reasoning about the Carbon Cycle Matter: CO2 & H2O Matter: Organic matter & O2 Energy: Sunlight Photosynthesis Biosynthesis, digestion, food webs, fossil fuel formation Energy: Chemicalpotential energy Movement of CO2, H2O, and minerals Combustion, cellular respiration Energy: Work& heat
Carbon Percentage of high school students giving Level 5 responses: Approximately 2-5%
Carbon What Makes Level 5 Reasoning Hard? • Connecting scales • Different macroscopic events are explained by common atomic-molecular processes • Different macroscopic events are connected in large-scale systems • Basic chemistry • Atoms of gases can be rearranged into solid and liquid molecules • Chemical identities of substances and classes of substances • Understanding the power of models • One model can generate stories of many different events
Carbon Level 3 Reasoning about the Carbon Cycle The oxygen-carbondioxide cycle Sunlight Plants Plants Nutrients Food chains Carbon dioxide Oxygen Decay Animals Energy sources for plants: sunlight, nutrients, water Energy sources for animals: food, water Decomposers don’t need energy
Carbon Some Characteristics of Level 3 Reasoning • Focus on macroscopic events and systems • Separate stories about different events • Stories of gases are separate from stories of solids and liquids • Energy as conditions or materials needed to make something happen
Trends From Younger to Older Students: Characteristics of Accounts of Phenomena
Overall Conclusions Very few American high school students do better than Level 4 when they try to explain basic processes in environmental systems, such as watersheds, invasive species, plant growth, combustion, and decay. This leaves them poorly prepared to see connections among the actions we take, the environmental system services we depend on, and our collective future. Website: http://edr1.educ.msu.edu/EnvironmentalLit/index.htm
Thank You • Major Contributors • Lindsey Mohan, Chris Wilson, Beth Covitt, Kristin Gunckel, Blakely Tsurusaki, Hui Jin, Jing Chen, Hasan Abdel-Kareem, Rebecca Dudek, Josephine Zesaguli, Hsin-Yuan Chen, Brook Wilke, Ed Smith, Jim Gallagher, and Edna Tan at Michigan State University • Mark Wilson, Karen Draney, Jinnie Choi, and Yong-Sang Lee at the University of California, Berkeley. • National Science Foundation for funding the Environmental Literacy Project, LTER and the GK-12 Program Website: http://edr1.educ.msu.edu/EnvironmentalLit/index.htm
Where we are now… • Only a few students can explain basic processes in environmental systems, leaving them poorly prepared to see connections among the actions we take, the environmental system services we depend on, and our collective future.
Oxidation of Organic Carbon Engineered Systems What happens to a match when it burns? What happened to the gasoline when a car is empty? How could using gasoline affect global warming? What make materials energy-rich? % of Student Answers Level of Achievement
Citizenship Question: You go through the lunch line at school and see that they are serving hamburgers. Where did the hamburgers come from? The ground beef in the hamburger patties wasn’t always ground beef. It wasn’t even always beef. Fill in the table with your ideas about what it was and where it came from before it came to the school cafeteria. Trace the beef back asyou can.
Ranking Systems Put the following items in the boxes below, going from the smallest to the largest. Population, Gene, Species, DNA, Ecosystem, Dog, Chromosome
Environmental Literacy “Loop” Diagram Curriculum with Focus on Environmental Literacy Students will be Consumers, Voters,Workers,Volunteers, Advocates & Learners
Environmental Literacy Topics • Biodiversity: foods and land for living, settlement and management for production, processes that create, sustain, and reduce biodiversity • Carbon: foods and fuels, global climate change, processes that produce, transform, and oxidize organic carbon • Water: fresh water, water management, processes that move and distribute water, processes that alter water composition (data not included in presentation) • Citizenship: Practices of making decisions about human actions that use environmental system services or have environmental impact.
Biological Diversity and Change over Time in Environmental Systems
Data on student reasoning about structure/function, e.g. . . . and change over time, e.g.Pesticide resistance (Natural selection at the intersection between natural and human systems).
Genetic Variation • Very few students ever mentioned more than one possible source of phenotypic variation. • Genetic variation was only common as an answer when environmental variation could be ruled out.
Genetic Variation Farmers often use pesticides to help prevent insects from eating their crops. Over time, the insects slowly become resistant to these pesticides, and so the farmers have to use different pesticides to protect their crops. Tell a story about how the insects become resistant to the pesticides.
Pesticide Resistance % of Student Answers Level of Achievement