Download
1 / 24
240 likes | 339 Views
This study focuses on determining halide concentrations using capillary electrophoresis with leucigenin quenching and indirect detection methods. The research explores the benefits and limitations of this approach, providing insights into the analysis of minute samples with fast separation techniques. Experimental methods using fluoroscopy and fluorescence instrumentation are detailed, along with preliminary results and areas for further investigation. Acknowledgments for support and contributions are also included.

E N D
Aquious Halide Concentration Determination via Leucigenin Quenching and Indirect CE Christopher Hampton, Dr. Eamonn F. Healy, Chemistry Department, St. Edward’s University, Austin TX 78704
Background on Capillary Electrophoresis • Capillary (20-200x10^-6 M inner diameter) • High voltages • Electroosmotic Flow • Electrophoretic Flow • UV Spectroscopy • Benefits • Minute samples (uL Samples may be used) • Fast separation • Linear quantization
Electrophoretic/osmotic Flow • Electrophoretic Flow • µ=[Ld/tm]/[V/Lt] • Ld = length to detector • tm = migration time • V = voltage • Lt = total length • Electroosmotic Flow • Veo=[Edc(Zp)/4πn]/E • Edc = dielectric constant • Zp = Zeta potential • n = viscosity • E = electric field strength
CE Experimental Method • Instrument Used • P/ACE 5000 CE • Fused silica capillaries at 57cm x 75µm • Working length 50cm • 6 second pressure injections • Chemicals Used • All of ACS reagent grade • All solutions were made with Millipore water
Experimental Method, contd. • BGE Composition • Chromic Acid • 5 mM • Hydroxybenzenesulfonic Acid • 5 mM • Ratio of BGE’s 1:1 • Buffered with diethanolamine to pKa of DEA • pH 9.2
Indirect Detection • Background Electrolytes (BGE) • BGE1, BGE2 • UV absorbing species • Analytes displace electrolytes • Results in “negative” peak, analytes do not absorb • Negative peak flipped by software
Indirect Detection Methods • BGE composition • Chromic Acid • CAS [7738-94-5] • 5mM • Hydroxybenzenesulfonic Acid • CAS [1333-39-7] • 5mM • Ratio 1:1 • DEA (Diethylanolamine) • CAS [111-42-2] • pKa of DEA • ~pH 9.2
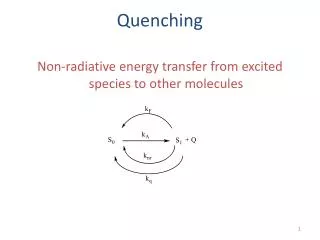
Fluorescence Work • Lucigenin has been widely known to be quenched by Chloride anions for a long time • This phenomenon has not been extensively studied, and no detailed analytical characterization has been done.
Fluoroscopy • Benefits • Small samples (3mL) • Widely available • Limitations • Not all materials fluoresce • Cost of fluorescent materials • Detection limits
Fluoroscopy Experimental Method • Instrument Used • Shimadzu RF 5301 PC Fluorometer • Suprasil 4mL Fluorescence cuvette (1cm base) • Chemicals Used • All of ACS reagent grade • Chloride solutions were made from a volumetric NaCl standard solution obtained from Sigma Aldrich (1g Cl- / 100g water) • All solutions were made with Millipore water
Experimental Method, contd. • Standards prepared • Lucigenin concentration from an ethanol stock, diluted in water • Solutions were combined in a capped cuvette, and vortexed for 30-45 seconds
Experimental Method, contd. • An excitation spectrum was obtained at 505nm • Maximum peak intensity and differentiation was consistently observed at 368 and 432 nm
Preliminary Results and Questions • 50 nano-molar concentration of Lucigenin, and a 50 micro-molar Cl- solutions. • 1000:1 ratio of Cl- to Lucigenin. • This can be further reduced, but with an increased of noise to signal ratio loss • Still working at concentrations that are showing very distinct patterns • We are approaching the limits of detection of our instrument and operator • Background Contamination of our water?
Discussion • Haddad and Dobble1 showed that a mixture of CrO4 and OHBSA could be used to separate a wide array of of cations and anions. • Applying the methods used, it can be shown that with few modifications, one can successfully separate mixtures of cations and anions in concentrations in the parts-per-billion (ppb) ranges. • This work focused solely on chloride (Cl-), even at the low concentrations optimum peak shape and consistent retention times were achieved.
Ok, but is it real? • Still working at concentrations that are showing very distinct patterns • We are approaching the limits of detection of our instrument and operator • Contamination of our water?
Where are we going from here? • CE is going to make or break it. • Buffer has been problematic • Repeat of 25 nm fluorescence data set (clean it up some) • Lower the Cl- : Lucigenin ratio to 1:100 (I.e. 10-1µM Cl-) • Determine Cl specificity vs. other halide salts
Acknowledgements • We gratefully acknowledge the support of the Welch Foundation in the form of a Departmental Research Grant • Dr. Eamonn Healy and the Saint Edward’s University chemistry faculty • Mr. Jon Steuernegel, Nathan Svadlenak, Brent Polishak, et al, for their continued assistance and support