Download
1 / 40
400 likes | 568 Views
X-Ray Microanalysis - Determination of Elemental Concentration How do we get from counts to concentration?. miscellaneo. cations on 10. <o,cl> basis Wt.% Cations P2O5 0.1801 P 0.0786 0.0093

E N D
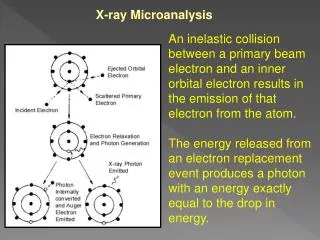
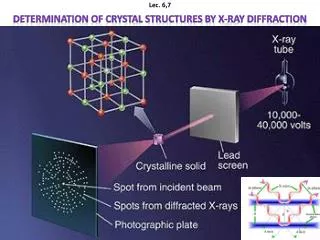
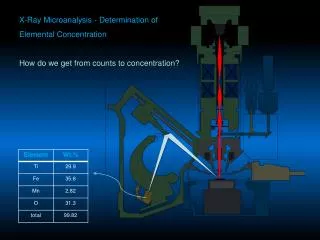
X-Ray Microanalysis - Determination of Elemental Concentration How do we get from counts to concentration?
miscellaneo. cations on 10. <o,cl> basis Wt.% Cations P2O5 0.1801 P 0.0786 0.0093 SiO2 49.6343 Si 23.2004 3.0375 TiO2 1.9337 Ti 1.1592 0.0890 Al2O3 14.1515 Al 7.4896 1.0207 MgO 6.9709 Mg 4.2036 0.6360 CaO 11.2084 Ca 8.0106 0.7349 MnO 0.2575 Mn 0.1994 0.0133 FeO 12.2786 Fe 9.5442 0.6284 Na2O 2.8663 Na 2.1264 0.3401 K2O 0.1967 K 0.1633 0.0154 Cl 0.0440 total 99.7219 6.5246 o = Cl -0.0099 total 99.7120 Ratio (Fe+Mn)/(Fe+Mn+Mg) = 50.23
Pulses converted to counts at a selected wavelength or energy corresponding to an element Intensity (I) = counts per sec / nA 1) counts are corrected for dead time 2) background is subtracted 3) then compare to standard of known composition For example: wt.fraction Si = ISiKα (unknown) / ISiKα (pure std.) K-ratio = [ISiKα (unknown) / ISiKα (std.)] x Cstd Cstd relates concentration in std to pure element K x 100 = uncorrected wt.% Peak cps Bkg cps
Corrections and X-Ray Interactions with Matter Recall that X-rays are generated within the interaction volume Defined by mean free path of electrons Critical excitation potential Always dealing with measured intensity of emerging X-rays Incident beam Characteristic X-rays Sample Absorption Fluorescence
Corrections and X-Ray Interactions with Matter measured intensity…Ii < I0 Ii Sample I0 Absorption Fluorescence
What affects measured intensity? • Samples and standards are not pure elements = “matrix effects” • Differential backscattering • Different bulk densities • Different scattering and ionization cross sections • Differences in the relationship between electron energy loss and distance traveled (stopping power) • X-ray absorption • Secondary fluorescence • Minimize corrections by using standards close in composition and physical properties to the sample Z A F
How do we correct for these effects? Three general approaches… ZAF Generalized algebraic procedure Generates separate factors for : Z atomic number A absorption F fluorescence Standard ZAF approach Φ(ρZ)Usedepth distribution of X-ray generation – express ZAF effects PAP (Pouchou and Pichoir) PROZA (Bastin and Heijligers) X-Phi (Merlet) Empirical Based on relative intensities from known specimens in a specific compositional range Bence-Albee procedure
One general approach in use today… Φ(ρZ) Usedepth distribution of X-ray generation – express ZAF effects PAP (Pouchou and Pichoir) PROZA (Bastin and Heijligers) X-Phi (Merlet) Many variations in this approach, mainly centering on the estimation of the area constrained by Φ(ρZ)
For any correction procedure to work: • Sample must be homogeneous in interaction volume – note – fluorescence range may be quite high - interface problems • Must have high polish and must not be tilted relative to the beam • No use of chemical etching or polishing techniques
ZAF Z = atomic number factor (matrix effects and beam electrons) Backscattering (R) Electron stopping power (S) Expression for average Z…
Low ρ and ave Z High ρ and ave Z
Z Backscattering (R) Electron stopping power (S) Duncomb and Reed (1968) Ri = BSE correction factor for element i in sample (*) and standard = photons generated / photons generated without backscatter E0= beam energy EC = critical excitation potential Q= ionization cross section S = electron stopping power
Expression for stopping power (Hans Bethe, 1930) E = electron energy (eV) x = path length e = 2.718 (base of ln) N0 = Avogadro constant Z = atomic number ρ = density A = atomic mass J = mean excitation energy (eV) Or… Can be expressed as mass distance… -1/ρ(dE/dx) (in g/cm2)
BSE factor R Fraction of ionization remaining in target after loss due to backscattering of beam electrons Function of atomic # and overvoltage (U) To evaluate, sum values for all elements present: For the standard: From tables For the sample: C = wt. fraction of element R = BSE correction i = measured element j = elements present in specimen
Absorption Correction (A) X-rays absorbed as they pass through specimen Reduces the observed intensity, following a Beer-Lambert relationship Sheffield Hallam Chemistry Castaing (1951) Intensity of characteristic radiation (no absorption case) Intensity of element i from layer of thickness dZ of density ρ at depth Z Φ(ρZ) is the distribution of characteristic X-ray production with depth
The total flux for element I (no absorption), is then… And the total flux with absorption is then… Incident beam Characteristic X-rays μ / ρ = mass absorption coefficient for the X-ray Ψ = take-off angle (μ / ρ) cscΨis referred to asΧ (chi) Ψ Sample
Crystal monochromator Proportional counter d is known - solvefor λ by changing θ Move crystal and detector to select different X-ray lines Si Kα S Kα Cl Kα Ti Kα Gd Lα sample Maintain Bragg condition = motion of crystal and detector along circumference of circle (Rowland circle)
If generated intensity is F(0) when X = 0 and emitted intensity is F(X) Then we can define F(X) / F(0) as f (X) Which is formulated as… And the absorption correction is…
The absorption correction factor f(X) for a characteristic X-ray of element i is a function of: μ / ρ mass absorption coefficient Ψ take-off angle E0 beam energy EC critical excitation potential Z atomic # A atomic wt. Therefore…
The calculation of f(x)includes the estimation of Φ(ρZ), which can be done in a number of ways The approach in standard ZAF uses the Philibert approximation, which treats Φ(ρZ) as an exponential function No X-ray production at surface Philibert approximation Φ(ρZ) True shape ρZ
What factors increase absorption? High voltage = deep X-ray production Low take-off angle High μ / ρ like soft X-rays in matrix with heavy atoms Functionality of Philibert expression for Φ(ρZ) breaks down in high absorption situations and leads to large errors Standard ZAF is good for metals Not good for oxides, silicates Poor for ultralight elements (CNO)
Fluorescence factor (F) If the energy of a characteristic X-ray from element j exceeds the critical excitation potential for element i, can get photoelectric absorption X-rays from i are fluoresced So, a sample of olivine has Fe, Mg and Si. Fe Kα = 6.4 keV Binding energies… Mg K = 1.30 keV Si K = 1.84 keV So Fe Ka excites both Si Kα and Mg Kα, resulting in “too much” intensity for Mg and Si K L M Kα
Fluorescence factor (F) Electrons attenuated more effectively than photons, so fluorescence range can be considerably larger than interaction volume * * = specimen Ifij = intensity by fluorescence of element i by element j Ii= electron generated intensity of i Sum for all elements
Fluorescence and absorption… A sample of olivine has Fe, Mg and Si. Fe Kα = 6.4 keV Binding energies… Mg K = 1.30 keV Si K = 1.84 keV Fe Kα excites both Si Kα and Mg Kα, resulting in “too much” intensity for Mg and Si, meanwhile, the Fe Kα intensity decreases due to absorption by Si and Mg, resulting in “too little” intensity of Fe… However, Fe LIII edge (binding energy) = 707 eV reduces Mg Kα and Si Kα intensities, so competing factors! K L M Kα
Fluorescence at a distance… High energy Fe Kα fluoresces Ca Kα in adjacent phase. Analysis “sees” Ca at this beam position. Ca Kα Ca Kα Fe-Ca silicate Fe silicate Fe-Ca sil.
In many cases, must correct for fluorescence caused by background radiation Very important when analyzing a minor amount of a heavy element in a light matrix (Ti in quartz!) For this reason, if looking for trace elements in light matrix: Choose the softest (lowest energy) line possible Use standards similar to unknowns in terms of average Z
ZAF correction • Determine K for all elements – a first approximation • Determine ZAF factors • Compute new approximation • Compute new ZAF factors • Iterate until results converge (usually 2-4 iterations is sufficient) Important: Must analyze all elements present in sample Minimize correction factors by using standards similar to unknowns Absorption corrections can be quite substantial in silicates and oxides, so standard ZAF not used for these materials Use: Φ(ρZ) or Bence-Albee (empirical)
Φ(ρZ) techniques Obtain f(X) by using equations that describe Φ(ρZ) curves for various elements, X-ray lines, and beam voltages The object, therefore, is to develop a mathematical expression designed to match experimental curves, e.g. Φ(ρz) = γ exp - α2(ρz)2 { 1- [(γ - Φ(0)) exp - βρz ] / γ } (Packwood and Brown) Can then determine corrections for Z and A Must still do separate calculation for F…
Φ(ρZ) techniques For Z Calculate the area under the Φ(ρZ) curve For A Express f(X) in terms of Φ(ρZ) The combined expression is then… [ γ R(X /2α) - (γ - Φ(0)) R(( β + X) / 2 α)] / α-1 ZiAi = [γ R(X /2 α) - (γ - Φ (0)) R((β + X) / 2 α)]*/ α*-1 Can then get the complete ZAF correction by combining with standard F expression
How to determine Φ(ρZ) curves – different models Packwood and Brown (1981) Plot Φ(ρZ) vs. (ρZ)2 = straight line beyond Φ max lnΦ(ρZ) (ρZ)2, mg2/cm4 Means Φ(ρZ) curves are gaussian centered on the surface of the sample modify by application of a transient function to make the curve look like experimental curve
Φ(ρZ) ρZ
Love-Scott Use quadrilateral profile and calculate Z and A factors separately
Pouchou and Pichoir (PAP) Describe Φ(ρZ) curve with pair of intersecting parabolas Breaks down the curve into four parameters Calculate the Z correction implicitly on the way to the final formula
Elt. Peak Prec. Bkgd P/B Ix/ Sig/k Detection Beam (Cps) (%) (Cps) Istd (%) limit (%) (nA) 10.1 Na 97.0 4.1 3.4 28.89 0.2071 4.2 0.1141 K 16.2 10.1 3.9 4.18 0.0162 10.2 0.0659 Mg 382.9 1.1 4.5 84.58 0.3620 1.2 0.0215 Si 2177.7 0.5 12.2 178.49 0.6044 0.5 0.0461 Al 497.7 1.0 5.2 95.08 1.0622 1.0 0.0333 P 2.5 14.1 0.9 2.78 0.0035 14.1 0.0565 Cl 4.0 11.2 2.0 1.98 0.0006 11.3 0.0339 Ca 644.6 0.9 8.6 75.39 1.0074 1.0 0.0339 Ti 104.4 2.2 8.4 12.43 0.0177 2.2 0.0323 Mn 6.5 8.8 2.1 3.17 0.0057 8.8 0.0680 Fe 222.3 1.5 3.7 60.92 1.0369 1.6 0.0825
Elt. k-ratio Correc. Na 0.0101 2.1033 K 0.0014 1.1396 Mg 0.0262 1.6039 Si 0.1756 1.3212 Al 0.0521 1.4378 P 0.0005 1.4519 Cl 0.0004 1.2455 Ca 0.0725 1.1054 Ti 0.0096 1.2024 Mn 0.0016 1.2264 Fe 0.0788 1.2110
99.7% of area 95.4% of area 68.3% of area N = # of counts 3σ 2σ 1σ 1σ 2σ 3σ
Elt. Conc. 1sigma Norm Conc. Norm Conc. (wt%) (wt%) (wt%) (at%) Na 2.1264 0.093549 2.1325 2.0582 K 0.1633 0.024284 0.1638 0.0929 Mg 4.2036 0.051090 4.2158 3.8486 Si 23.2004 0.121850 23.2674 18.3817 Al 7.4896 0.089185 7.5112 6.1768 P 0.0786 0.020254 0.0788 0.0565 Cl 0.0440 0.012308 0.0441 0.0276 Ca 8.0106 0.083576 8.0337 4.4474 Ti 1.1592 0.028746 1.1626 0.5385 Mn 0.1994 0.029309 0.2000 0.0808 Fe 9.5442 0.171398 9.5718 3.8029 O 43.4927 43.6183 60.4882 bystoichiometry total : 99.7120 100.0000 100.0000 Counting statistics here includes both peak and background on both unknown and calibration standard…
miscellaneo. cations on 10. <o,cl> basis Wt.% Cations P2O5 0.1801 P 0.0786 0.0093 SiO2 49.6343 Si 23.2004 3.0375 TiO2 1.9337 Ti 1.1592 0.0890 Al2O3 14.1515 Al 7.4896 1.0207 MgO 6.9709 Mg 4.2036 0.6360 CaO 11.2084 Ca 8.0106 0.7349 MnO 0.2575 Mn 0.1994 0.0133 FeO 12.2786 Fe 9.5442 0.6284 Na2O 2.8663 Na 2.1264 0.3401 K2O 0.1967 K 0.1633 0.0154 Cl 0.0440 total 99.7219 6.5246 o = Cl -0.0099 total 99.7120 Ratio (Fe+Mn)/(Fe+Mn+Mg) = 50.23
All Φ(ρZ) and ZAF corrections depend on the quality of input data Mass absorption coefficients Ionization cross sections Backscatter coefficients Surface ionization potentials Because Φ(ρZ)routines model X-ray production near the surface reasonably well Can be used on oxides and silicates Ultralight elements (B, C, N, O)