Download
1 / 17
170 likes | 191 Views
Understand empirical likelihood theory, methods, and applications, allowing hypothesis testing and confidence region construction without assumptions of parametric distributions. Explore key statistical tests and applications in survival analysis.

E N D
Empirical Likelihood Mai Zhou Dept. of Statistics, University of Kentucky
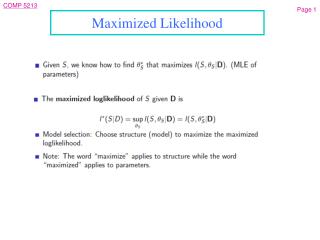
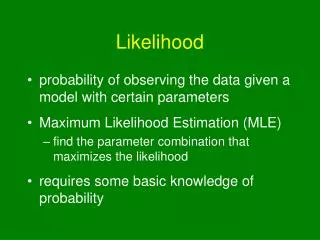
Any first year Statistical Inference course will talk about “likelihood”. • For independent observations the likelihood is • Notice f(a)dx = P( X=a )
Three inference methods (tests) based on likelihood: • 1. Wald test • 2. Score test (Rao’s Score test) • 3. Likelihood ratio test (Wilks) • Empirical likelihood is a nonparametric version of 3
Empirical Likelihood allows the statistician to employ likelihood methods, without having to pick a parametric family of distributions for the data. --- Owen • Empirical Likelihood allows for hypothesis testing and confidence region construction without an information/variance estimator.- me • Plus many additional nice properties.
A new (2001) book by A. Owen “Empirical Likelihood” . But in the Cox model the (partial) likelihood ratio exists for a long time (over 20 years). SAS proc phreg, Splus function coxph( ) all have it computed. Claim: The (partial) likelihood ratio statistic for the regression coefficients in the Cox model can be interpreted as a case of the Empirical Likelihood Ratio. (Pan 1997)
For n observations, • independent, from the empirical likelihood is • EL(F) = Where
Censored Observations • For a right censored observation • The likelihood contribution is • For a left censored observation the contribution is • Interval censored:
Truncated observations For a left truncated observation (often referred toas delayed entry) : (entry time, survival time) = • The likelihood contribution is • If the survival time is right censored, then the likelihood contribution is
Empirical Likelihood Theorem: • If the null hypothesis is true then • if the hypothesis is not true, the quantity above will be larger.
R = Gnu S/Splus http://cran.us.r-project.org + many add-on packages A Package for empirical likelihood with censored/truncated data Contributed package – emplik (maintained by Mai Zhou) • It Does Empirical likelihood ratio tests for mean or weighted hazard, based on left-truncated, right censored or left, right, doubly censored data.
Tests hypothesis of the form: with right, left, doubly censored data. Or with left-truncated, right censored data.
Example: Data taken from Klein & Moeschberger (1997) Survival Analysis book as reported in their table 1.7 • y = left truncation time • = (51, 58, 55, 28, 25, 48, 47, 25, 31, 30, 33, 43, 45, 35, 36) • x = survival times of female psychiatric inpatients • = (52, 59, 57, 50, 57, 59, 61, 61, 62, 67, 68, 69, 69, 65, 76) • d = censoring status • = ( 1, 1, 1, 1, 1, 1, 1, 1, 0, 0, 0, 1, 1, 0, 1 )
> library(emplik) > el.ltrc.EM( y, x, d, mu=62) The mean of the NPMLE is 63.18557. • (if ‘fun’ is left out, then fun=t, by default). Two of the outputs are -2LLR = 0.2740571 Pval = 0.6006231
Repeat the test for many different values of the mean. (mu=59, etc. ) • If the hypothesized mean is inside • [58.78936, 67.81304], the p-value of the test is larger then 0.05. ----- the 95% confidence interval for the mean is • [58.78936, 67.81304]
For doubly censored data, the standard deviation of the NPMLE is hard to compute. • The Wald test/confidence interval is hard to do. • No problem with empirical likelihood ratio! • No need to estimate the standard deviation, instead, we need to maximize EL under some constraint. • The maximization can be achieved with the help of modern computing. (E-M algorithm etc.)