Sampling Distribution and Confidence Intervals in Statistics
Explore the concepts of sampling distribution, standard error, and confidence intervals in statistics. Learn how to estimate population means and calculate probabilities in different scenarios.

Sampling Distribution and Confidence Intervals in Statistics
E N D
Presentation Transcript
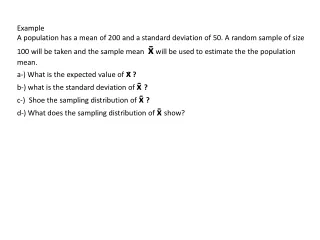
Example A population has a mean of 200 and a standard deviation of 50. A random sample of size 100 will be taken and the sample mean x̄ will be used to estimate the the population mean. a-) What is the expected value ofx̄ ? b-) what is the standard deviation of x̄? c-) Shoe the sampling distribution of x̄? d-) What does the sampling distribution of x̄show?
Example Assume the population standard deviation is σ = 25 . Compute the standard error of the mean, σx̄ for sample sizes of 50, 100, 150 and 200. What can you say about the size of the standard error of the mean as the sample size is increased ?
Example A population has a mean of 200 and a standard deviation of 50. Suppose a random sample of size 100 is selected and the sample mean x̄ will be used to estimate the population mean. a-) What is the probability that the sample mean will be within ± 5 of the population mean ? b-) What is the probability that the sample mean will be within ± 10 of the population mean ?
Example 3: If a random sample of size 30 is taken from binomial distribution with n=9 and p= 0.5 Q: Find the probability that the sample mean exceeds 5.
Example 4: Suppose we have selected a random sample of n=36 observations from a population with mean equal to 80 and standard deviation equal to 6. Q: Find the probability that x̄ will be larger than 82.
Exercise - 1 A package-filling process at a Cement company fills bags of cement to an average weight of µ but µ changes from time to time. The standard deviation is σ = 3 pounds. A sample of 25 bags has been taken and their mean was found to be 150 pounds. Assume that the weights of the bags are normally distributed. Find the 90% confidence limits for µ.
Exercise - 3 An economist is interested in studying the incomes of consumers in a particular region. The population standard deviation is known to be $1,000. A random sample of 50 individuals resulted in an average income of $15,000. What is the upper end point in a 99% confidence interval for the average income?
Exercise - 4 An economist is interested in studying the incomes of consumers in a particular region. The population standard deviation is known to be $1,000. A random sample of 50 individuals resulted in an average income of $15,000. What is the width of the 90% confidence interval?
Exercise - 5 The head librarian at the Library of Congress has asked her assistant for an interval estimate of the mean number of books checked out each day. The assistant provides the following interval estimate: from 740 to 920 books per day. If the head librarian knows that the population standard deviation is 150 books checked out per day, and she asked her assistant for a 95% confidence interval, approximately how large a sample did her assistant use to determine the interval estimate?