Bayesian Learning
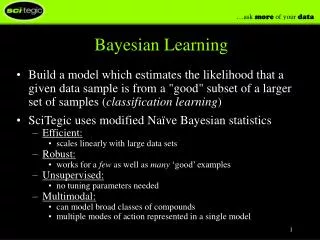
Understand Bayesian learning through a sensor example involving classifying good and bad oranges and making optimal decisions based on Bayesian rules for minimizing risk.

Bayesian Learning
E N D
Presentation Transcript
Bayesian Learning Thanks to Nir Friedman, HU .
sensor Example • Suppose we are required to build a controller that removes bad oranges from a packaging line • Decision are made based on a sensor that reports the overall color of the orange Bad oranges
Classifying oranges Suppose we know all the aspects of the problem: Prior Probabilities: • Probability of good (+1) and bad (-1) oranges • P(C = +1) = probability of a good orange • P(C = -1) = probability of a bad orange • Note: P(C = +1) + P(C = -1)= 1 • Assumption: oranges are independent The occurrence of a bad orange does not depend on previous
p(X | C = -1 ) p(X | C = +1 ) Classifying oranges (cont) Sensor performance: • Let X denote sensor measurement from each type of oranges
Bayes Rule • Given this knowledge, we can compute the posterior probabilities Bayes Rule
Data likelihood p(X | C = -1 ) P(C = -1 ) p(X | C = -1 ) p(C = -1 |X) p(X | C = +1 ) P(C = +1)p(X | C = +1 ) … combined with prior… after normalization … P(C = +1|X) 1 0 Posterior of Oranges
p(C = -1 |X) P(C = +1|X) 1 0 good bad bad Decision making Intuition: • Predict “Good” if P(C=+1 | X) > P(C=-1 | X) • Predict “Bad”, otherwise
Loss function • Assume we have classes +1, -1 • Suppose we can make predictions a1,…,ak • A loss function L(ai,cj)describes the loss associated with making prediction ai when the class is cj Real Label Prediction
Expected Risk • Given the estimates of P(C | X) we can compute the expected conditional risk of each decision
p(C = -1 |X) P(C = +1|X) 1 0 The Risk in Oranges 10 R(Good|X) 5 R(Bad|X) 0
Optimal Decisions Goal: • Minimize risk Optimal decision rule: “Given X = x, predict ai if R(ai|X=x) = mina R(a|X=x) “ • (break ties arbitrarily) Note: randomized decisions do not help
0-1 Loss • If we don’t have prior knowledge, it is common to use the 0-1 loss • L(a,c) = 0 if a = c • L(a,c) = 1 otherwise Consequence: • R(a|X) = P(a c|X) • Decision rule:“choose ai if P(C = ai | X) = maxa P(C = a|X) “
Bayesian Decisions: Summery Decisions based on two components: • Conditional distribution P(C|X) • Loss function L(A,C) Pros: • Specifies optimal actions in presence of noisy signals • Can deal with skewed loss functions Cons: • Requires P(C|X)
Simple Statistics : Binomial Experiment • When tossed, it can land in one of two positions: Head or Tail • We denote by the (unknown) probability P(H). Estimation task: • Given a sequence of toss samples x[1], x[2], …, x[M] we want to estimate the probabilities P(H)= and P(T) = 1 - Head Tail
Why Learning is Possible? Suppose we perform M independent flips of the thumbtack • The number of heads we see has a binomial distribution • and thus This suggests, that we can estimate by
Maximum Likelihood Estimation MLE Principle: Learn parameters that maximize the likelihood function • This is one of the most commonly used estimators in statistics • Intuitively appealing • Well studied properties
Computing the Likelihood Functions • To compute the likelihood in the coin tossing example we only require NH and NT (the number of heads and the number of tails) • Applying the MLE principle we get • NH and NT are sufficient statistics for the binomial distribution
Datasets Statistics Sufficient Statistics • A sufficient statistic is a function of the data that summarizes the relevant information for the likelihood • Formally, s(D) is a sufficient statistics if for any two datasets D and D’ • s(D) = s(D’ ) L( |D) = L( |D’)
Maximum A Posterior (MAP) • Suppose we observe the sequence • H, H • MLE estimate is P(H) = 1, P(T) = 0 • Should we really believe that tails are impossible at this stage? • Such an estimate can have disastrous effect • If we assume that P(T) = 0, then we are willing to act as though this outcome is impossible
Laplace Correction Suppose we observe n coin flips with k heads • MLE • Laplace correction: As though we observed one additional H and one additional T • Can we justify this estimate? Uniform prior!
Bayesian Reasoning • In Bayesian reasoning we represent our uncertainty about the unknown parameter by a probability distribution • This probability distribution can be viewed as subjective probability • This is a personal judgment of uncertainty
Bayesian Inference We start with • P() - prior distribution about the values of • P(x1, …, xn|) - likelihood of examples given a known value Given examples x1, …, xn, we can compute posterior distribution on Where the marginal likelihood is
Binomial Distribution: Laplace Est. • In this case the unknown parameter is = P(H) • Simplest prior P() = 1 for 0< <1 • Likelihood where k is number of heads in the sequence • Marginal Likelihood:
Marginal Likelihood Using integration by parts we have: Multiply both side by n choose k, we have
Marginal Likelihood - Cont • The recursion terminates when k = n Thus We conclude that the posterior is
Bayesian Prediction • How do we predict using the posterior? • We can think of this as computing the probability of the next element in the sequence • Assumption: if we know , the probability of Xn+1 is independent of X1, …, Xn
Bayesian Prediction • Thus, we conclude that
Bayesian Classification: Binary Domain Consider the following situation: • Two classes: -1, +1 • Each example is described by by N attributes • Xn is a binary variable with value 0,1 Example dataset:
Binary Domain - Priors How do we estimate P(C) ? • Simple Binomial estimation • Count # of instances with C = -1, and with C = +1
Training set for P(X1,…,XN|C=+1): Training set for P(X1,…,XN|C=-1): Binary Domain - Attribute Probability How do we estimate P(X1,…,XN|C) ? Two sub-problems:
Naïve Bayes Naïve Bayes: • Assume This is an independence assumption • Each attribute Xi is independent of the other attributes once we know the value of C
Naïve Bayes:Boolean Domain • Parameters: • for each i How do we estimate 1|+1? • Simple binomial estimation • Count #1 and #0 values of X1in instances where C=+1
Interpretation of Naïve Bayes • Each Xi “votes” about the prediction • If P(Xi|C=-1) = P(Xi|C=+1) then Xi has no say in classification • If P(Xi|C=-1) = 0 then Xi overrides all other votes (“veto”)
Interpretation of Naïve Bayes Set Classification rule
N(0,12) N(4,22) Normal Distribution The Gaussian distribution: 0.4 0.3 0.2 0.1 0 -4 -2 0 2 4 6 8 10
Maximum Likelihood Estimate • Suppose we observe x1, …, xm Simple calculations show that the MLE is • Sufficient statistics are
Naïve Bayes with Gaussian Distributions • Recall, • Assume: • Mean of Xidepends on class • Variance of Xi does not
Naïve Bayes with Gaussian Distributions Recall Distance between means Distance of Xi to midway point
Different Variances? • If we allow different variances, the classification rule is more complex • The term is quadratic in Xi