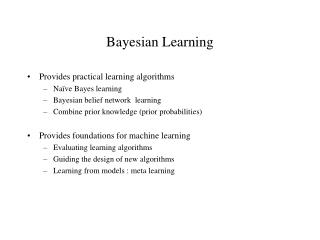
Bayesian Learning in Machine Learning
Learn about Bayesian learning in supervised machine learning for two classes, including the Bayesian rule, maximum likelihood optimization, Gaussian models, and multivariate Gaussian classification. Explore examples and applications of Bayesian methods in classification and likelihood estimation.

Bayesian Learning in Machine Learning
E N D
Presentation Transcript
Bayesian learning UsmanRoshan CS 675 Machine Learning
Supervised learning for two classes • We are given n training samples (xi,yi) for i=1..n drawn i.i.d from a probability distribution P(x,y). • Each xi is a d-dimensional vector ( ) and yi is +1 or -1 • Our problem is to learn a function f(x) for predicting the labels of test samples xi’ (in Rd ) for i=1..n’ also drawn i.i.d from P(x,y)
Classification: Bayesian learning • Bayes rule: • To classify a given datapointx we select the model (class) Mi with the highest P(Mi|x) • The denominator is a normalizing term and does not affect the classification of a given datapoint. Therefore • P(x|M) is called the likelihood and P(M) is the prior probability. To classify a given datapointx we need to know the likelihood and the prior. • If priors P(M) are uniform (the same) then finding the model that maximizes P(M|D) is the same as finding M that maximizes the likelihood P(D|M).
Maximum likelihood • We can classify by simply selecting the model M that has the highest P(M|D) where D=data, M=model. Thus classification can also be framed as the problem of finding M that maximizes P(M|D) • By Bayes rule:
Maximum likelihood • Suppose we have k models to consider and each has the same probability. In other words we have a uniform prior distribution P(M)=1/k. Then • In this case we can solve the classification problem by finding the model that maximizes P(D|M). This is called the maximum likelihood optimization criterion.
Maximum likelihood • Suppose we have n i.i.d. samples (xi,yi) drawn from M. The likelihood P(D|M) is • Consequently the log likelihood is
Maximum likelihood and empirical risk • Maximizing the likelihood P(D|M) is the same as maximizing log(P(D|M)) which is the same as minimizing -log(P(D|M)) • Set the loss function to • Now minimizing the empirical risk is the same as maximizing the likelihood (return to this later again)
Maximum likelihood example • Consider a set of coin tosses produced by a coin with P(H)=p (P(T)=1-p) • We want to determine the probability P(H) of the coin that produces k heads and n-k tails? • We are given some tosses (training data): HTHHHTHHHTHTH. • Solution: • Form the log likelihood • Differentiate w.r.t. p • Set to the derivative to 0 and solve for p
Classification by likelihood • Suppose we have two classes C1 and C2. • Compute the likelihoods P(D|C1) and P(D|C2). • To classify test data D’ assign it to class C1 if P(D|C1) is greater than P(D|C2) and C2 otherwise.
Gaussian models • Assume that class likelihood is represented by a Gaussian distribution with parameters μ (mean) and σ (standard deviation) • We find the model (in other words mean and variance) that maximize the likelihood (or equivalently the log likelihood). Suppose we are given training points x1,x2,…,xn1 from class C1. Assuming that each datapoint is drawn independently from C1 the sample log likelihood is
Gaussian models • The log likelihood is given by • By setting the first derivatives dP/dμ1 and dP/dσ1 to 0. This gives us the maximum likelihood estimate of μ1 and σ1 (denoted as m1 and s1 respectively) • Similarly we determine m2 and s2 for class C2.
Gaussian models • After having determined class parameters for C1 and C2 we can classify a given datapoint by evaluating P(x|C1) and P(x|C2) and assigning it to the class with the higher likelihood (or log likelihood). • The likelihood can also be used as a loss function and has an equivalent representation in empirical risk minimization (return to this later).
Gaussian classification example • Consider one dimensional data for two classes (SNP genotypes for case and control subjects). • Case (class C1): 1, 1, 2, 1, 0, 2 • Control (class C2): 0, 1, 0, 0, 1, 1 • Under the Gaussian assumption case and control classes are represented by Gaussian distributions with parameters (μ1, σ1) and (μ2, σ2) respectively. The maximum likelihood estimates of means are
Gaussian classification example • The estimates of class standard deviations are • Similarly s2=.25 • Which class does x=1 belong to? What about x=0 and x=2? • What happens if class variances are equal?
Multivariate Gaussian classification • Suppose each datapoint is an m-dimensional vector. In the previous example we would have m SNP genotypes instead of one. The class likelihood is given by • Where Σ1 is the class covariance matrix. Σ1 is of dimensiona d x d. The (i,j)th entry of Σ1 is the covariance of the ith and jth variable.
Multivariate Gaussian classification • The maximum likelihood estimates of η1 and Σ1 are • The class log likelihoods with estimated parameters (ignoring constant terms) are
Multivariate Gaussian classification • If S1=S2 then the class log likelihoods with estimated parameters (ignoring constant terms) are • Depends on distance to means.
Naïve Bayes algorithm • If we assume that variables are independent (no interaction between SNPs) then the off-diagonal terms of S are zero and the log likelihood becomes (ignoring constant terms)
Nearest means classifier • If we assume all variances sj to be equal then (ignoring constant terms) we get
Gaussian classification example • Consider three SNP genotype for case and control subjects. • Case (class C1): (1,2,0), (2,2,0), (2,2,0), (2,1,1), (0,2,1), (2,1,0) • Control (class C2): (0,1,2), (1,1,1), (1,0,2), (1,0,0), (0,0,2), (0,1,0) • Classify (1,2,1) and (0,0,1) with the nearest means classifier