Operating and Financial Leverage
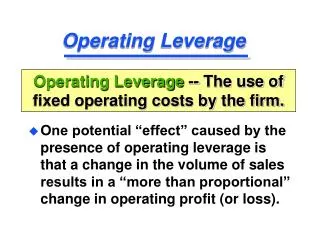
Operating and Financial Leverage. Operating Leverage. One potential “effect” caused by the presence of operating leverage is that a change in the volume of sales results in a “more than proportional” change in operating profit (or loss).

Operating and Financial Leverage
E N D
Presentation Transcript
Operating Leverage • One potential “effect” caused by the presence of operating leverage is that a change in the volume of sales results in a “more than proportional” change in operating profit (or loss). Operating Leverage -- The use of fixed operating costs by the firm.
Impact of Operating Leverage on Profits (in thousands) Firm F Firm V Sales $10 $11 Operating Costs Fixed 7 2 Variable 2 7 Operating Profit$1 $ 2 FC/total costs .78 .22 FC/sales .70 .18
Impact of Operating Leverage on Profits • Now, subject each firm to a 50% increase in sales for next year. • Which firm do you think will be more “sensitive” to the change in sales (i.e., show the largest percentage change in operating profit, EBIT)? [ ] Firm F; [ ] Firm V;
Impact of Operating Leverage on Profits (in thousands) Firm F Firm V Sales $15 $16.5 Operating Costs Fixed 7 2 Variable 3 10.5 Operating Profit$5 $ 4 Percentage Change in EBIT* 400% 100% * (EBITt - EBIT t-1) / EBIT t-1
Impact of Operating Leverage on Profits • Firm F is the most “sensitive” firm -- for it, a 50% increase in sales leads to a 400% increase in EBIT.
Break-Even Analysis • When studying operating leverage, “profits” refers to operating profits before taxes (i.e., EBIT) and excludes debt interest and dividend payments. Break-Even Analysis -- A technique for studying the relationship among fixed costs, variable costs, sales volume, and profits. Also called cost/volume/profit (C/V/P) analysis.
Break-Even Chart QUANTITY PRODUCED AND SOLD Total Revenues Profits 250 Total Costs 175 REVENUES AND COSTS ($ thousands) Fixed Costs 100 Losses Variable Costs 50 0 1,000 2,000 3,000 4,000 5,000 6,000 7,000
Break-Even (Quantity) Point Break-Even Point -- The sales volume required so that total revenues and total costs are equal; may be in units or in sales dollars. How to find the quantity break-even point: EBIT = P(Q) - V(Q) - FC EBIT = Q(P - V) - FC P = Price per unitV = Variable costs per unit FC = Fixed costs Q = Quantity (units) produced and sold
Break-Even (Quantity) Point Breakeven occurs when EBIT = 0 Q (P - V) - FC = EBIT QBE (P - V) - FC = 0 QBE (P - V) = FC QBE = FC/ (P - V) a.k.a. Unit Contribution Margin
Break-Even (Sales) Point How to find the sales break-even point: SBE =FC + (VCBE) SBE =FC + (QBE )(V) or SBE * =FC / [1 - (VC / S) ] * Refer to text for derivation of the formula
Break-Even Point Example • Basket Wonders (BW) wants to determine both the quantity and sales break-even points when: • Fixed costs are $100,000 • Baskets are sold for $43.75each • Variable costs are $18.75 per basket
Break-Even Point (s) Breakeven occurs when: QBE = FC/ (P - V) QBE = $100,000/ ($43.75 - $18.75) QBE = 4,000 Units SBE =(QBE )(V) + FC SBE =(4,000 )($18.75) + $100,000 SBE = $175,000
Break-Even Chart QUANTITY PRODUCED AND SOLD Total Revenues Profits 250 Total Costs 175 REVENUES AND COSTS ($ thousands) Fixed Costs 100 Losses Variable Costs 50 0 1,000 2,000 3,000 4,000 5,000 6,000 7,000
Degree of Operating Leverage (DOL) DOL at Q units of output (or sales) Degree of Operating Leverage -- The percentage change in a firm’s operating profit (EBIT) resulting from a 1 percent change in output (sales). Percentage change in operating profit (EBIT) = Percentage change in output (or sales)
Computing the DOL DOLQ units Calculating the DOL for a single product or a single-product firm. Q (P - V) = Q (P - V) - FC Q = Q - QBE
Computing the DOL DOLS dollars of sales Calculating the DOL for a multiproduct firm. S - VC = S - VC - FC EBIT + FC = EBIT
Break-Even Point Example • Lisa Miller wants to determine the degree of operating leverage at sales levels of 6,000 and 8,000 units. As we did earlier, we will assume that: • Fixed costs are $100,000 • Baskets are sold for $43.75each • Variable costs are $18.75 per basket
Computing BW’s DOL DOL6,000 units Computation based on the previously calculated break-even point of 4,000 units 6,000 3 = = 6,000 - 4,000 8,000 2 = • DOL8,000 units = 8,000 - 4,000
Interpretation of the DOL A 1% increase in sales above the 8,000 unit level increases EBIT by 2% because of the existing operating leverage of the firm. 8,000 2 = • DOL8,000 units = 8,000 - 4,000
DOL and Business Risk Business Risk -- The inherent uncertainty in the physical operations of the firm. Its impact is shown in the variability of the firm’s operating income (EBIT). • DOL is only one component of business risk and becomes “active” only in the presence of sales and production cost variability. • DOL magnifies the variability of operating profits and, hence, business risk.
Application of DOL Use the earlier data and the following formula for Firm F: DOL = [(EBIT + FC)/EBIT] 1,000 +7,000 = • DOL$10,000 sales 8.0 = 1,000
Application of DOL Use the earlier data and the following formula for Firm V: DOL = [(EBIT + FC)/EBIT] 2,000 +2,000 = • DOL$11,000 sales 2.0 = 2,000
Application of DOL The ranked results indicate that the firm most sensitive to the presence of operating leverage is Firm F. Firm FDOL = 8.0 Firm VDOL = 6.6 Firm F will expect a 400% increase in profit from a 50% increase in sales
Financial Leverage • Financial leverage is acquired by choice. • Used as a means of increasing the return to common shareholders. Financial Leverage -- The use of fixed financing costs by the firm. The British expression is gearing.
EBIT-EPS Break-Even, or Indifference, Analysis EBIT-EPS Break-Even Analysis -- Analysis of the effect of financing alternatives on earnings per share. The break-even point is the EBIT level where EPS is the same for two (or more) alternatives. Calculate EPS for a given level of EBIT at a given financing structure. (EBIT - I) (1 - t) - Pref. Div. EPS = # of Common Shares
Current common equity shares = 50,000 $1 million in new financing of either: All C.S. sold at $20/share (50,000 shares) All debt with a coupon rate of 10% Expected EBIT = $500,000 Income tax rate is 30% Basket Wonders has $2 million in LT financing (100% common stock equity). EBIT-EPS Chart
EBIT $500,000 $150,000* Interest 0 0 EBT $500,000 $150,000 Taxes (30% x EBT) 150,000 45,000 EAT $350,000 $105,000 Preferred Dividends 0 0 EACS $350,000 $105,000 # of Shares 100,000 100,000 EPS $3.50 $1.05 Common Stock Equity Alternative EBIT-EPS Calculation with New Equity Financing * A second analysis using $150,000 EBIT rather than the expected EBIT.
EBIT-EPS Chart 6 5 Common 4 3 Earnings per Share ($) 2 1 0 0 100 200 300 400 500 600 700 EBIT ($ thousands)
EBIT $500,000 $150,000* Interest 100,000 100,000 EBT $400,000 $ 50,000 Taxes (30% x EBT) 120,000 15,000 EAT $280,000 $ 35,000 Preferred Dividends 0 0 EACS $280,000 $ 35,000 # of Shares 50,000 50,000 EPS $5.60 $0.70 Long-term Debt Alternative EBIT-EPS Calculation with New Debt Financing * A second analysis using $150,000 EBIT rather than the expected EBIT.
EBIT-EPS Chart Debt 6 5 Indifference point between debtand common stock financing Common 4 3 Earnings per Share ($) 2 1 0 0 100 200 300 400 500 600 700 EBIT ($ thousands)
Degree of Financial Leverage (DFL) DFL at EBIT of X dollars Degree of Financial Leverage -- The percentage change in a firm’s earnings per share (EPS) resulting from a 1 percent change in operating profit. Percentage change in earnings per share (EPS) = Percentage change in operating profit (EBIT)
Computing the DFL DFL EBIT of $X Calculating the DFL EBIT = EBIT - I EBIT = Earnings before interest and taxes I = Interest
What is the DFL for Each of the Financing Choices? DFL$500,000 Calculating the DFL for NEW equity* alternative $500,000 = $500,000 - 0 = 1.00 * The calculation is based on the expected EBIT
What is the DFL for Each of the Financing Choices? DFL$500,000 Calculating the DFL for NEW debt * alternative $500,000 = $500,000 - 100,000 = $500,000/ $400,000 = 1.25 * The calculation is based on the expected EBIT
Variability of EPS DFLEquity = 1.00 DFLDebt = 1.25 Which financing method will have the greatest relative variability in EPS? • Debt financing will lead to the greatest variability in earnings per share based on the DFL. • This is due to the tax deductibility of interest on debt financing.
Financial Risk Financial Risk -- The added variability in earnings per share (EPS) -- plus the risk of possible insolvency -- that is induced by the use of financial leverage. • Debt increases the probability of cash insolvency over an all-equity-financed firm. For example, our example firm must have EBIT of at least $100,000 to cover the interest payment. • Debt also increased the variability in EPS as the DFL increased from 1.00 to 1.25.
Total Firm Risk Total Firm Risk -- The variability in earnings per share (EPS). It is the sum of business plus financial risk. • Total firm risk = business risk + financial risk
Degree of Total Leverage (DTL) DTL at Q units (or S dollars) of output (or sales) Degree of Total Leverage -- The percentage change in a firm’s earnings per share (EPS) resulting from a 1 percent change in output (sales). Percentage change in earnings per share (EPS) = Percentage change in output (or sales)
Computing the DTL DTL S dollars of sales DTL Q units (or S dollars) = ( DOL Q units (or S dollars) ) x ( DFL EBIT of X dollars ) EBIT + FC = EBIT - I Q (P- V) DTL Q units = Q (P- V) - FC - I
DTL Example • Lisa Miller wants to determine the Degree of Total Leverage at EBIT=$500,000. As we did earlier, we will assume that: • Fixed costs are $100,000 • Baskets are sold for $43.75each • Variable costs are $18.75 per basket
Computing the DTL for All-Equity Financing DTL S dollars of sales DTLS dollars = (DOL S dollars) x (DFLEBIT of $S ) DTLS dollars = (1.2 ) x ( 1.0*) = 1.20 $500,000 + $100,000 = $500,000 - 0 1.20 = *Note: No financial leverage.
Computing the DTL for Debt Financing DTL S dollars of sales DTLS dollars = (DOL S dollars) x (DFLEBIT of $S ) DTLS dollars = (1.2 ) x ( 1.25*) = 1.50 $500,000 + $100,000 = $500,000 - $100,000 1.50 = *Note: Calculated earlier.
Risk versus Return Compare the expected EPS to the DTL for the common stock equity financing approach to the debt financing approach. FinancingE(EPS) DTL Equity $3.50 1.20 Debt $5.60 1.50 Greater expected return (higher EPS) comes at the expense of greater potential risk (higher DTL)!
What is an Appropriate Amount of Financial Leverage? Debt Capacity -- The maximum amount of debt (and other fixed-charge financing) that a firm can adequately service. • Firms must first analyze their expected future cash flows. • The greater and more stable the expected future cash flows, the greater the debt capacity. • Fixed charges include: debt principal and interest payments, lease payments, and preferred stock dividends.
Interest Coverage EBIT Interest expenses Indicates a firm’s ability to cover interest charges. Coverage Ratios Income Statement Ratios Coverage Ratios A ratio value equal to 1 indicates that earnings are just sufficient to cover interest charges.
Debt-service Coverage EBIT { Interest expenses + [Principal payments / (1-t) ] } Indicates a firm’s ability to cover interest expenses and principal payments. Coverage Ratios Income Statement Ratios Coverage Ratios Allows us to examine the ability of the firm to meet all of its debt payments. Failure to make principal payments is also default.
Coverage Example • Make an examination of the coverage ratios for Basket Wonders when EBIT=$500,000. Compare the equity and the debt financing alternatives. • Assume that: • Interest expenses remain at $100,000 • Principal payments of $100,000 are made yearly for 10 years
Coverage Example Compare the interest coverage and debt burden ratios for equity and debt financing. Interest Debt-service FinancingCoverage Coverage Equity Infinite Infinite Debt 5.00 2.50 The firm actually has greater risk than the interest coverage ratio initially suggests.
Coverage Example Firm B has a much smaller probability of failing to meet its obligations than Firm A. Firm B Firm A PROBABILITY OF OCCURRENCE Debt-service burden = $200,000 -250 0 250 500 750 1,000 1,250 EBIT ($ thousands)