Operating Leverage
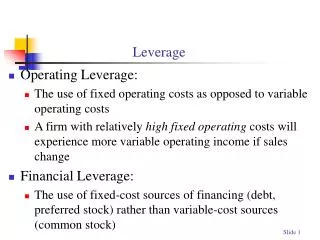
Operating Leverage. One potential “effect” caused by the presence of operating leverage is that a change in the volume of sales results in a “more than proportional” change in operating profit (or loss). Operating Leverage -- The use of fixed operating costs by the firm.

Operating Leverage
E N D
Presentation Transcript
Operating Leverage • One potential “effect” caused by the presence of operating leverage is that a change in the volume of sales results in a “more than proportional” change in operating profit (or loss). Operating Leverage -- The use of fixed operating costs by the firm.
Impact of Operating Leverage on Profits (in thousands) Firm F Firm V Sales $10 $11 Operating Costs Fixed 7 2 Variable 2 7 Operating Profit$1 $ 2 FC/total costs .78 .22 FC/sales .70 .18
Impact of Operating Leverage on Profits • Now, subject each firm to a 50% increase in sales for next year. • Which firm do you think will be more “sensitive” to the change in sales (i.e., show the largest percentage change in operating profit, EBIT)? [ ] Firm F; [ ] Firm V;
Impact of Operating Leverage on Profits (in thousands) Firm F Firm V Sales $15 $16.5 Operating Costs Fixed 7 2 Variable 3 10.5 Operating Profit$5 $ 4 Percentage Change in EBIT* 400% 100% * (EBITt - EBIT t-1) / EBIT t-1
Impact of Operating Leverage on Profits • Firm F is the most “sensitive” firm -- for it, a 50% increase in sales leads to a 400% increase in EBIT.
Break-Even Analysis • When studying operating leverage, “profits” refers to operating profits before taxes (i.e., EBIT) and excludes debt interest and dividend payments. Break-Even Analysis -- A technique for studying the relationship among fixed costs, variable costs, sales volume, and profits. Also called cost/volume/profit (C/V/P) analysis.
Break-Even Chart QUANTITY PRODUCED AND SOLD Total Revenues Profits 250 Total Costs 175 REVENUES AND COSTS ($ thousands) Fixed Costs 100 Losses Variable Costs 50 0 1,000 2,000 3,000 4,000 5,000 6,000 7,000
Break-Even (Quantity) Point Break-Even Point -- The sales volume required so that total revenues and total costs are equal; may be in units or in sales dollars. How to find the quantity break-even point: EBIT = P(Q) - V(Q) - FC EBIT = Q(P - V) - FC P = Price per unitV = Variable costs per unit FC = Fixed costs Q = Quantity (units) produced and sold
Break-Even Chart QUANTITY PRODUCED AND SOLD Total Revenues Profits 250 Total Costs 175 REVENUES AND COSTS ($ thousands) Fixed Costs 100 Losses Variable Costs 50 0 1,000 2,000 3,000 4,000 5,000 6,000 7,000
Degree of Operating Leverage (DOL) DOL at Q units of output (or sales) Degree of Operating Leverage -- The percentage change in a firm’s operating profit (EBIT) resulting from a 1 percent change in output (sales). Percentage change in operating profit (EBIT) = Percentage change in output (or sales)
Computing the DOL DOLQ units Calculating the DOL for a single product or a single-product firm. Q (P - V) = Q (P - V) - FC Q = Q - QBE
Computing the DOL DOLS dollars of sales Calculating the DOL for a multiproduct firm. S - VC = S - VC - FC EBIT + FC = EBIT
Break-Even Point Example • Lisa Miller wants to determine the degree of operating leverage at sales levels of 6,000 and 8,000 units. As we did earlier, we will assume that: • Fixed costs are $100,000 • Baskets are sold for $43.75each • Variable costs are $18.75 per basket
Computing BW’s DOL DOL6,000 units Computation based on the previously calculated break-even point of 4,000 units 6,000 3 = = 6,000 - 4,000 8,000 2 = • DOL8,000 units = 8,000 - 4,000
Interpretation of the DOL A 1% increase in sales above the 8,000 unit level increases EBIT by 2% because of the existing operating leverage of the firm. 8,000 2 = • DOL8,000 units = 8,000 - 4,000
DOL and Business Risk Business Risk -- The inherent uncertainty in the physical operations of the firm. Its impact is shown in the variability of the firm’s operating income (EBIT). • DOL is only one component of business risk and becomes “active” only in the presence of sales and production cost variability. • DOL magnifies the variability of operating profits and, hence, business risk.
Financial Leverage • Financial leverage is acquired by choice. • Used as a means of increasing the return to common shareholders. Financial Leverage -- The use of fixed financing costs by the firm. The British expression is gearing.
EBIT-EPS Break-Even, or Indifference, Analysis EBIT-EPS Break-Even Analysis -- Analysis of the effect of financing alternatives on earnings per share. The break-even point is the EBIT level where EPS is the same for two (or more) alternatives. Calculate EPS for a given level of EBIT at a given financing structure. (EBIT - I) (1 - t) - Pref. Div. EPS = # of Common Shares
Current common equity shares = 50,000 $1 million in new financing of either: All C.S. sold at $20/share (50,000 shares) All debt with a coupon rate of 10% Expected EBIT = $500,000 Income tax rate is 30% Basket Wonders has $2 million in LT financing (100% common stock equity). EBIT-EPS Chart
EBIT $500,000 $150,000* Interest 0 0 EBT $500,000 $150,000 Taxes (30% x EBT) 150,000 45,000 EAT $350,000 $105,000 Preferred Dividends 0 0 EACS $350,000 $105,000 # of Shares 100,000 100,000 EPS $3.50 $1.05 Common Stock Equity Alternative EBIT-EPS Calculation with New Equity Financing * A second analysis using $150,000 EBIT rather than the expected EBIT.
EBIT-EPS Chart 6 5 Common 4 3 Earnings per Share ($) 2 1 0 0 100 200 300 400 500 600 700 EBIT ($ thousands)
EBIT $500,000 $150,000* Interest 100,000 100,000 EBT $400,000 $ 50,000 Taxes (30% x EBT) 120,000 15,000 EAT $280,000 $ 35,000 Preferred Dividends 0 0 EACS $280,000 $ 35,000 # of Shares 50,000 50,000 EPS $5.60 $0.70 Long-term Debt Alternative EBIT-EPS Calculation with New Debt Financing * A second analysis using $150,000 EBIT rather than the expected EBIT.
EBIT-EPS Chart Debt 6 5 Indifference point between debtand common stock financing Common 4 3 Earnings per Share ($) 2 1 0 0 100 200 300 400 500 600 700 EBIT ($ thousands)
Degree of Financial Leverage (DFL) DFL at EBIT of X dollars Degree of Financial Leverage -- The percentage change in a firm’s earnings per share (EPS) resulting from a 1 percent change in operating profit. Percentage change in earnings per share (EPS) = Percentage change in operating profit (EBIT)
Computing the DFL DFL EBIT of $X Calculating the DFL EBIT = EBIT - I EBIT = Earnings before interest and taxes I = Interest
Degree of Total Leverage (DTL) DTL at Q units (or S dollars) of output (or sales) Degree of Total Leverage -- The percentage change in a firm’s earnings per share (EPS) resulting from a 1 percent change in output (sales). Percentage change in earnings per share (EPS) = Percentage change in output (or sales)