Operating Leverage Financial Leverage
Ch. 15: Analysis and Impact of Leverage. Operating Leverage Financial Leverage. 2002, Prentice Hall, Inc. What is Leverage?. What is Leverage?. What is Leverage?. 2 concepts that enhance our understanding of risk. 1) Operating Leverage - affects a firm’s business risk .

Operating Leverage Financial Leverage
E N D
Presentation Transcript
Ch. 15: Analysis and Impact of Leverage • Operating Leverage • Financial Leverage 2002, Prentice Hall, Inc.
2 concepts that enhance our understanding of risk... 1) Operating Leverage - affects a firm’s business risk. 2) Financial Leverage - affects a firm’s financial risk.
Business Risk • The variability or uncertainty of a firm’s operating income (EBIT).
EBIT Business Risk • The variability or uncertainty of a firm’s operating income (EBIT).
FIRM EBIT Business Risk • The variability or uncertainty of a firm’s operating income (EBIT).
FIRM EPS EBIT Business Risk • The variability or uncertainty of a firm’s operating income (EBIT).
Stock- holders FIRM EPS EBIT Business Risk • The variability or uncertainty of a firm’s operating income (EBIT).
Stock- holders FIRM EPS EBIT Business Risk • The variability or uncertainty of a firm’s operating income (EBIT).
Business Risk Affected by: • Sales volume variability • Competition • Cost variability • Product diversification • Product demand • Operating Leverage
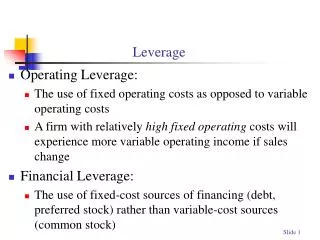
Operating Leverage • The use of fixed operating costs as opposed to variable operating costs. • A firm with relatively high fixed operating costs will experience more variable operating income if sales change.
EBIT Operating Leverage
Financial Risk • The variability or uncertainty of a firm’s earnings per share (EPS) and the increased probability of insolvency that arises when a firm uses financial leverage.
Stock- holders FIRM EPS EBIT Financial Risk • The variability or uncertainty of a firm’s earnings per share (EPS) and the increased probability of insolvency that arises when a firm uses financial leverage.
Stock- holders FIRM EPS EBIT Financial Risk • The variability or uncertainty of a firm’s earnings per share (EPS) and the increased probability of insolvency that arises when a firm uses financial leverage.
Financial Leverage • The use of fixed-cost sources of financing (debt, preferred stock) rather than variable-cost sources (common stock).
EPS Financial Leverage
Breakeven Analysis • Illustrates the effects of operating leverage. • Useful for forecasting the profitability of a firm, division or product line. • Useful for analyzing the impact of changes in fixed costs, variable costs, and sales price.
$ Quantity Breakeven Analysis
Total Revenue $ Quantity
Costs • Suppose the firm has both fixed operating costs (administrative salaries, insurance, rent, property tax) and variable operating costs (materials, labor, energy, packaging, sales commissions).
Total Revenue $ Quantity
Total Revenue Total Cost $ { FC Quantity
Total Revenue Total Cost $ { FC Quantity } EBIT + - Q1
Total Revenue Total Cost $ } EBIT + - { FC Q1 Quantity Break- even point
Operating Leverage • What happens if the firm increases its fixed operating costs and reduces (or eliminates) its variable costs?
Total Revenue Total Cost $ } EBIT + - { FC Q1 Quantity Break- even point
Total Revenue } $ EBIT + { Total Cost = Fixed - FC Q1 Quantity Break- even point
With high operating leverage, an increase in sales produces a relatively larger increase in operating income.
Total Revenue } $ EBIT + { Total Cost = Fixed - FC Q1 Quantity Break- even point
Total Revenue } $ EBIT + { Total Cost = Fixed - FC Q1 Quantity Break- even point Trade-off: the firm has a higher breakeven point. If sales are not high enough, the firm will not meet its fixed expenses!
F P - V QB = Breakeven Calculations Breakeven point (units of output)
F P - V QB = Breakeven Calculations Breakeven point (units of output) • QB = breakeven level of Q. • F = total anticipated fixed costs. • P = sales price per unit. • V = variable cost per unit.
F VC S S* = 1 - Breakeven Calculations Breakeven point (sales dollars)
F VC S S* = 1 - Breakeven Calculations Breakeven point (sales dollars) • S* = breakeven level of sales. • F = total anticipated fixed costs. • S = total sales. • VC = total variable costs.
Analytical Income Statement sales - variable costs - fixed costs operating income - interest EBT - taxes net income
Analytical Income Statement } contribution margin sales - variable costs - fixed costs operating income - interest EBT - taxes net income
Analytical Income Statement } contribution margin sales - variable costs - fixed costs operating income - interest EBT - taxes net income EBT (1 - t) = Net Income, so, Net Income / (1 - t) = EBT
Degree of Operating Leverage (DOL) • Operating leverage: by using fixed operating costs, a small change in sales revenue is magnified into a larger change in operating income. • This “multiplier effect” is called the degree of operating leverage.
Degree of Operating Leveragefrom Sales Level (S) % change in EBIT % change in sales DOLs =
Degree of Operating Leveragefrom Sales Level (S) % change in EBIT % change in sales DOLs = change in EBIT EBIT change in sales sales =
Degree of Operating Leveragefrom Sales Level (S) • If we have the data, we can use this formula:
Sales - Variable Costs EBIT DOLs = Degree of Operating Leveragefrom Sales Level (S) • If we have the data, we can use this formula:
Sales - Variable Costs EBIT DOLs = Q(P - V) Q(P - V) - F = Degree of Operating Leveragefrom Sales Level (S) • If we have the data, we can use this formula:
What does this tell us? • If DOL = 2, then a 1% increase in sales will result in a 2% increase in operating income (EBIT).