Download
1 / 2
20 likes | 155 Views
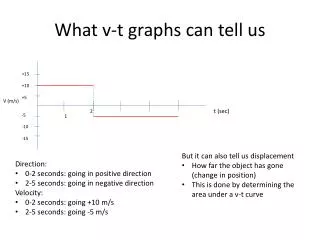
Velocity-time (v-t) graphs provide insights into an object's motion by illustrating its velocity over time. They reveal critical information such as displacement, which is determined by calculating the area under the curve. In this example, during the first 2 seconds, the object moves positively at +10 m/s, covering +20 m. From 2 to 5 seconds, it moves negatively at -5 m/s, resulting in a total displacement of +5 m when combining both intervals. Analyzing these graphs helps in understanding motion patterns effectively.

E N D
What v-t graphs can tell us +15 +10 +5 V (m/s) t (sec) 2 -5 -10 -15 1 • But it can also tell us displacement • How far the object has gone (change in position) • This is done by determining the area under a v-t curve • Direction: • 0-2 seconds: going in positive direction • 2-5 seconds: going in negative direction • Velocity: • 0-2 seconds: going +10 m/s • 2-5 seconds: going -5 m/s
So what’s the object’s TOTAL displacement throughout the entire trip? • 20 m – 15 m = +5 m +15 +10 +5 V (m/s) t (sec) -5 -10 -15 10 m/s • Determine the object’s displacement from 2-5 seconds • -15 m 2 sec. Area = length x width During the time frame of 0-2 sec. the object traveled a total of +20 m from start to finish