Download
1 / 55
550 likes | 651 Views
Politics of Racial & Social Change. Three Groupings in United States Cities. Roots of Racial Segregation in the Cities. Exodus from the rural south to urban ghettos After World War I: a trickle After World War II: mass migration Informal covenants kept African Americans in ghettos

E N D
Politics of Racial & Social Change Three Groupings in United States Cities
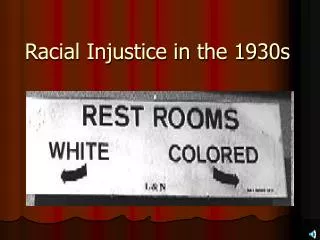
Roots of Racial Segregation in the Cities • Exodus from the rural south to urban ghettos • After World War I: a trickle • After World War II: mass migration • Informal covenants kept African Americans in ghettos • Even more extensive in southern cities
African American Mobilization for Change • Booker T. Washington as spokesman for individualistic integration • NAACP – first national African American advocacy group • Civil Rights Movement & African American Establishment • Returning veterans from World War II • SCLC and Martin Luther King Jr. • African Urban Churches
Anger and political mobilization Martin Luther King: “I have a dream” Huey P. Newton & Bobby Seale
Nation of Islam Elijah Muhammad Established Muslim Temple in Detroit (1934) Complete separation from white society Louis Farrakan: current leader
Alternatives to the African-American Establishment: Malcolm X • Began as a collaborator of Elijah Muhammad • Mission to the urban poor • Radical anti-white perspective that modified toward the end • Assassinated – 1965
More Riots in American Cities • Trajectory of Riots/Urban Violence • Cleveland 1966 • Newark 1967 • Detroit 1967 • Washington, D.C. 1968 • Los Angeles again 1992 • Cincinnati 2001
Watts (Los Angeles) Riots August – 1965 • Triggered by arrest for drunk driving by California patrol • People gathered and resentment toward police boiled over • Anger over repeal of fair housing act • $35 million in property damage – mostly in African-American areas • 34 people killed • 1032 injured
African Americans and Voting Rights • 1965 Voting Rights Act • Federal government could appoint voting examiners who could register people • Suspended literacy tests • Justice Department must approve changes voting laws and voter qualifications • Attorney General has authority to enforce provisions of the act
African Americans and Voting • Controversy Surrounding “at large” elections • Courts and at large elections • Rejected attempts to move from ward to at large elections • Hasn’t struck down existing at large systems • When changes requested federal government has forced cities to guarantee representation to minorities
Redistricting & Minority Voting Rights: Recent Decisions • Nature of redistricting • How much minority population should a minority district have? • 65% majority rule of thumb
Road to African-American Political Incorporation Remains Unclear • Levels of political incorporation • Weak mobilization and exclusion • Protest and exclusion (Oakland before 1977) • Weak mobilization and incorporation (San Francisco during 1970’s) • Biracial electoral alliance and strong incorporation (Berkeley)
African American Mayors: Pioneers and part of the establishment Mayor Tom Bradley of Los Angeles, 1973-1993
Incorporation in 21st Century • Expands public sector opportunities for minorities • African American Mayors (strategies of responsiveness) • Private sector investment in areas where there are large numbers of African-Americans • Aggressive affirmative action in competition for public sector jobs in the cities
Current Status Hispanics constitute the largest minority group in the United States Hispanics account for 41.3 million people in the US 14.3 % of the US population is of Hispanic origin Growth rate for Hispanics is 3.6 % compared to 1.0 % overall population growth
Current Status • Hispanic population in each region: • Northeast – 9.8 % • Midwest – 4.9 % • South – 11.6 % • West – 24.3 % • Top Three States: • New Mexico – 42.1 % • California – 32.4 % • Texas – 32 %
Voter Turnout • 2006: • 73 % voted Democrat • 26% voted Republican • 2004: • 55 % voted Democrat • 42% voted Republican
Political Diversity • Cubans and Colombians tend to favor conservative political ideologies and support the Republicans • Mexicans, Puerto Ricans, and Dominicans lean more towards the Democrats • Mexicans make up approximately 63% of all Hispanics in the US while Cubans only constitute 4%. Dominicans and Puerto Ricans make up another 13%. • Note that the location of the Hispanic population also influences party affiliation. • California Latinos voted 63-32 for John Kerry in 2004 • Arizona and New Mexico Latinos by a smaller 56-43 margin • Texas Latinos were split nearly evenly • Florida Latinos (mostly being Cuban American) backed President Bush by a 54-45 margin.
2006 Midterm Election • Hispanics voted overwhelmingly Democrat, with a lopsided 69-30 margin. For the first time Florida Latinos were split evenly. • The key element leading to this voting behavior was the heated immigration debate and H.R. 4437 (The Border Protection, Anti-terrorism, and Illegal Immigration Control Act of 2005). - H.R. 4437 passed the House by a vote of 239 to 182, with 92% of Republicans supporting, 82% of Democrats opposing.
Religious diversity • 70% are Roman Catholic • 23% are Protestant, 85% of which are Evangelical or Pentecostal. • Less than 1% are Jewish. • Most are descendants of Ashkenazi Jews who migrated from Europe particularly to Argentina. • Less than 1% are Muslims.
Mexico - History • Pre-Colonization: Southwest inhabited by Native Americans and Spanish • 1810: Miguel Hidalgo y Costilla – Mexican Independence • 1821: Mexico opens borders to United States • Trade regions • Hunting • Settlement
Mexico - History • Highly unstable government • U.S.-Mexico War: 1846 • Treaty of Guadalupe-Hidalgo: 1848 • $15 million for the northern third of Mexico • Recognized prior land grants in the Southwest • Offered citizenship to any Mexicans residing in the area • 1845-1854: the United States acquires half of Mexico
Mexicans – Immigration Trends • 1848: <15,000 Mexican Americans (outside of New Mexico) • 1890: 75,000+ Mexicans had migrated to the United States. • 1900: Mexicans (immigrants and native-born) totaled between 381,000 and 562,000 • Cycles of mass immigration from Mexico followed by efforts at deportation and voluntary departure
Mexicans – Labor Force • Correlation between the need for labor and the increase/decrease of Mexican immigrants
Mexicans – Current Status • Make up 64% of the Hispanic population in the United States. • Cities with high Mexican population: • Chicago (IL) • Houston (TX) • Los Angeles (CA) • Median Income of Mexican-American families (2000): $27,600
Mexicans – Political Mobilization • The Catholic Church • Unions • Industrial Workers of the World • United Mine Workers of America • United Farm Workers • Democratic Party • Republican Party
Mexicans - Political lssues Making undocumented immigrants legal Defense of immigrant workers’ rights.
Case of San Antonio • Growing numbers of Mexican Americans in 1960s/1970s • Annexation in 1975 • Diluted Mexican American voting strength • Council seat districts created to insure representation to African Americans and Mexican Americans • Broad coalition elects Henry Cisneros
Cuba – History Former Spanish Colony Independence movement – Ten Years’ War (1868) Short truce, then Spanish American War (1898) U.S. granted Cuba independence with certain guidelines (1902) Fall of the Cuban Republic government and U.S. relations – Depression, Batista, Mafia (1902-1959) Rise of Fidel Castro and the fall of U.S. investments. (1959)
Cubans – Recent Immigration • 1st Wave (1960-1980): • Followed Castro’s Cuban Revolution • Hundreds of thousands, upper/middle classes • 2nd Wave (1980s): • Followed economic downturn • Est. 120,000 – some from jails/mental asylums • Mariel Boatlift Crisis – disliked by Cuban Americans • 3rd Wave (1994): • Followed political turmoil • Est. 35,000 during summer months • Aug. 23: 3,253 intercepted by Coast Guard • Balsero Rafter Crisis
Cubans - Location • Largest populations of Cuban Americans • Miami, FL • Hialeah, FL • Union City, NJ • New York, NY • Key West, FL • Tampa, FL
Cubans - Location • Transformed Miami into a distinct modern city • Outside of Miami, have assimilated into American Culture • States with high Cuban population growth: • California • Georgia • Illinois • North Carolina • Virginia
Cubans - Population • 1.5 million Cuban Americans • 4 % of US Hispanic population • Compared to overall Hispanic population • Older • More educated • More wealthy
Cuban Urban Politics • Felt most markedly in city of Miami • Cubans a slight majority of population • Anti-communism and conservatism more important than in other Hispanic-American communities • Tensions in African-American - Cuban relations in Miami • Corruption & electoral fraud led voters to approve (1997) a strong mayor system
Puerto Rico - Today • Pop. of 3.95 million living on the island • Puerto Ricans have US citizenship, currency, and defense • Can’t vote in presidential elections • Spanish and English are the official languages • Racial breakdown • Spanish (European) • Taino (Amerindian) • Africans
Puerto Ricans - Migration • Peak period of migration came after World War II. • During the 1940s, the population grew from 70,000 to 226,000. • By 1970 • 810,000 Puerto Rican migrants and another 581,000 mainland-born Puerto Ricans lived in the United States.
Puerto Ricans - Migration Currently there are 3.4 million Puerto Ricans living on the U.S. mainland Puerto Ricans are the second largest Latino group in the United States
Puerto Ricans- Status • Employment • In 2003, 20.7% were in professional-managerial occupations, 33.7 percent were in service-sales jobs. • Poverty • 22.8 % for families • Education • Of those 25 years and older, 63.2 % have graduated from high school • 9.9% have 4 yr. college degree
Brazil – Today • Largest and most populous country in South America • Only Portuguese speaking country in the Americas • Multiracial • Largest Roman Catholic population in the world • Largest protestant population in Latin America
Brazilians - Immigration • 87 % of Brazilians in US born in Brazil • 70% of Brazilians in US are illegal • Why Immigrate? • More than ½ have friends or relatives already in US • ¼ Permanently Immigrate
Brazilians - Immigration • Largest Brazilian Settlements on East Coast • By Population • Boston: 150,000 • New York: 80,000-150,000 • Florida: 65000 • California: 20,000 • Houston: 10,000 • Washington D.C.: 10,000
Chinese: First Large Scale Asian Migration to the United States • Central Pacific working from Sacramento toward Nebraska • 9,000 – 12,000 Chinese worked for Central Pacific • Paid only 60% of wages received by European immigrants • 3,336,966(1.2% of the US population)