
Enhancing Biorefinery Profitability Through Integrated Utility Management
This study explores the optimization of biorefineries by comparing integrated and non-integrated utility systems. The focus is on maximizing net present value (NPV) through efficiency gains by centralizing critical utilities such as water, heat, oxygen, and hydrogen. The research evaluates the profitability of producing several chemicals from switchgrass feedstock, with projections indicating an NPV of $35 billion over five years for the integrated model. The capacity planning model effectively identifies profitable processes, locations, and budgets, demonstrating the advantages of utility integration.

Enhancing Biorefinery Profitability Through Integrated Utility Management
E N D
Presentation Transcript
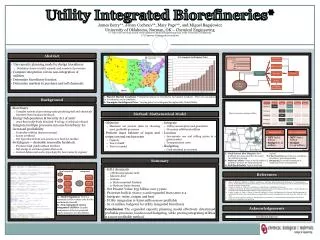
Utility Integrated Biorefineries* Process Flow Heat Water O2 H2 CO2 P29 Non-integrated Integrated P33 Utility 1 Process 1 P37 P40 James Berry**, Jenny Cochran**, Mary Page**, and Miguel Bagajewicz University of Oklahoma, Norman, OK – Chemical Engineering Process 1 Utility 2 P50 Central Utility Process 2 P53 Central Utility Process 2 Utility 3 (*) This work was done as part of the capstone Chemical Engineering class at the University of Oklahoma (**) Capstone Undergraduate students Process 3 Process 3 Abstract D. FarmgateSwitchgrass Price • Sell 5 chemicals • 3 Hydroxypropionic Acid • Glucaric Acid • Acetone • 5- Hydroxymethyl Furfural • 3- Hydroxy-butyrolactone • Net Present Value: $35 billion over 5 years • Processes built in years 1-3 and expanded from years 2-4 • Integrate: water, oxygen and heat • Utility integration is $200 million more profitable • $1.16 million budgeted for utility integrated biorefinery • Conclusion The expanded capacity planning model effectively determined profitable processes, location and budgeting, while proving integrating utilities is a more profitable method. • Use capacity planning model to design biorefinery • Determine times to build, expand, and number of processes • Compare integration versus non-integration of utilities • Determine biorefinery location • Determine markets to purchase and sell chemicals C. Plant & Market Locations E. Final Process Flow Diagram afdadsfa C. Plant & Market Locations Potential locations for biorefinery and market locations. There are 34 options for biorefineries and 24 markets. D. FarmgateSwitchgrass Price Varying prices of switchgrass throughout the United States Background Chart of necessary makeup utilities • Biorefinery • Complex system of processing units producing fuel and chemicals • Operates from biomass feedstock • Energy Independence & Security Act of 2007 • 2022 Renewable Fuels Standard 16 bgy of cellulosic ethanol • Integrate multiple processes into one biorefinery for increased profitability • Centralize utilities (harness energy) • Lower overhead • Use byproducts from one process as a feed for another • Switchgrass -- desirable renewable feedstock • Produces high yields without fertilizer • Net energy is 20 times greater than corn • Current delievered cost is $30-$50/dry ton (varies by region) Method: Mathematical Model • Objective • Maximize net present value by choosing most profitable processes • Perform mass balance of input and output around each process • Capacity • Year to build • Year to expand • Integrate • Utility consumption and generation • Necessary additional utilities • Location • Incorporate raw and selling prices in a given market • Transportation costs • Budgeting • Cash returned to investors F. Makeup Utilities G. Building Schedule H. Final Locations I. Budgeting • Final Process Flow Diagram Most profitable processes selected by the model and utilities integrated • Makeup Utilities Chart of outside utilities needed to purchase for integrated model • Building Schedule Years to build and expand • Final Locations Locations for switchgrass, biorefinery, and selling markets • Budgeting Economic comparison of integrated versus non-integrated Summary References • Aden, A.; Bozell, J.; Holladay, J.; White, J.; Manheim, A. Top Value Added Chemicals From Biomass. U.S. Department of Energy: Energy Efficiency and Renewable Energy. Produced by: Pacific Northwest National Laboratory & National Renewable Energy Laboratory. August 2004. • Carmer, J.; Waller, C.; Wilkes, D.; and Nizami, S.; Biorefineries. Unpublished. 4 May 2007. • Graham, R. and Walsh, M. A National Assessment of Promising Areas for Switchgrass, Hybrid Poplar, or Willow Energy Crop Production. Environmental Sciences Division. 4804. February 1999. • Lavaja, J.; Adler, A.; Jones, J.; Pham, T.; Smart, K.; Splinter, D.; Steele, M.; Bagajewicz, M.; Financial Risk Management for Investment Planning of New Commodities Considering Plant Location and Budgeting, Ind. Eng. Chem. Res. 2006, 45, 7582-7591. • Tran, T.; Patel, T.; Iland, T.; Truong, J.; Ibidapo-Obe, B.; Constantino, J.; OU Biorefining Technical Report for Biomass Production. Unpublished. 30 April 2004. • A. Model Equations This is a screenshot of the written code for the mathematical model. • B. Non-integrated versus Integrated Utilities Graphic comparison of the two potential utility structures in a biorefinery. Acknowledgements B. Utility Comparison DuyQuang Nguyen A. Model Equations


