Download
1 / 31
310 likes | 433 Views
Discover the distribution of water resources, including surface water and groundwater, and their environmental impacts. Learn about water usage, pollution prevention, and sustainable conservation practices. Explore how people harness water for electricity and manage saline groundwater. Gain insights into aquifer types, water table, and connections between surface water and groundwater. Uncover the challenges of managing water resources and the critical importance of responsible water use.

E N D
Water Resources Chapter 10
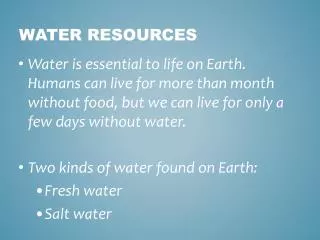
You will learn • Characteristics of various water resources, including surface water and groundwater, and the connections between them • How Earth’s water resources are distributed and how much water there is • How people use water, both in familiar ways and in ways with which you may be less familiar, such as electric power generation • The environmental impact of developing water resources by means of dams and groundwater pumping • How natural water quality varies, what water pollution is, what common water pollutants are, and where pollutants come from • How people can sustain water resources through careful use, prevention of pollution, and conservation
Hydrosphere Reservoirs • <1% of water on Earth is liquid freshwater, mostly groundwater. Surface freshwater available for human use amounts to only ~ 3/10,000 of Earth’s total water. • The hydrosphere contains a tremendous amount of water— about 1360 million km3 (326 million mi3)—would cover the entire U.S. to depth of 145 km (90 mi) or equivalent to 171 million gallons of water per person on Earth. Problem is that 97.2% is ocean water, which is too salty to drink or grow crops with. Just 2.8% is freshwater (including ice). Figure 10-3 Major Hydrosphere Reservoirs
Surface Water Resources • Surface waters are bodies of water—the oceans, springs, creeks, rivers, ponds, and lakes across the landscape—that you can encounter firsthand. • Excluding the oceans and seas most surface waters contain freshwater, but in some places, like the enclosed surface basins of the arid west evaporation has turned lakes salty. Example: the Great Salt Lake in Utah. • Modern societies similar to the Romans, have altered the landscape to exploit surface-water resources—canals, aqueducts, and artificial reservoirs have all been constructed over many years. Figure 10-4 The Great Salt Lake Because of a high evaporative rate this lake is 3x to 5x saltier than ocean water and is more dense, making floating easier.
Surface Water Parsing Figure 10-5 Parceling Out the Colorado (a) People have built dozens of dams, reservoirs, diversions, canals, and aqueducts to control flooding on the Colorado River and distribute its waters to thousands of municipalities and farms. This is the Palo Verde Dam, which diverts about 50 m3 (1800 ft3) of water per second to irrigate 490 km2 (120,000 acres) of land on the west side of the Colorado River in California. (b) Because so much water is diverted for human use, the river that finally reaches Mexico and the sea is shallow and salty.
Saline Waters from Irrigation Figure 10-6 The Colorado River Desalination Plant This plant was constructed to treat river water that had become salty through irrigation practices.
Groundwater Resources Figure 10-7 Water Underground Water that soaks into the ground partly fills open spaces (voids) in the unsaturated zone. The water table marks the depth at which the voids become completely filled with water. Below the water table the completely water-soaked ground is called the saturated zone. Surface bodies of water mark where the water table is exposed and where groundwater is connected to surface water.
Types of Aquifers Figure 10-8 Aquifers • Unconfined aquifers can be easily recharged by water migrating freely down from the ground surface. • Confined aquifers contain water below an impermeable layer. Because such aquifers are overlain by impermeable material, they can fill with water only through limited areas exposed at the surface–commonly a considerable distance away. • Confined aquifers typically are under pressure. • Perched aquifers develop in an unsaturated zone where downward movement of water is stopped by an impermeable layer before it can reach the main (or regional) water table.
Great Plains Aquifer—the Ogallala Figure 10-9 The High Plains Aquifer Groundwater withdrawal from this unconfined aquifer has lowered the water table over 46 m (150 ft) in places (red areas on map).
Surface Water and Groundwater Connections—the Edwards Aquifer Confined aquifers with enough pressure sometimes have water flowing at the surface without pumping—an artesian well. Figure 10-10 The Edwards Aquifer This confined aquifer system extends across seven Texas counties (a). It provides water for the famous River Walk in San Antonio. Surface water in recharge area comes from a northern part of the aquifer (called drainage area) separated from southern part by uplift along a series of faults (b).
Salty Groundwater Figure 10-11 Saline Groundwater in the United States Saline groundwater, a potential water resource, can be found at moderate depths through large parts of America.
Water Use in the U.S.A. Figure 10-12 A Thirsty Nation Freshwater withdrawals in the United States, by state. Note that the withdrawals given in the key are per square mile. Altogether, the total daily withdrawal is about 350 billion gallons (1.3 trillion L).
Freshwater—Multiple Uses Figure 10-13 Uses of Freshwater Water people use in their homes, commonly drawn from surface water reservoirs (a), is a small part of their total water use. Irrigation (b) and power generation (c) are two other large uses of freshwater. Supply and demand dictate the need to store and transfer water in some locations.
Water Withdrawal and the Environment Figure 10-14 Dams and Diversions (a) Large dams, like Grand Coulee-Columbia River in Washington, are used for recreation, power generation, flood control, and water supplies. (b) Canals and aqueducts such as the Los Angeles aqueduct transfers surface water from eastern California to the Los Angeles area, to where it is needed.
Dam Construction over Decades • Dam construction has essentially stopped in the U.S. Surface-water reservoir capacity has been about the same since 1980 (Fig. 10-16). Figure 10-16 U.S. Reservoir Capacity Reservoir capacity increased dramatically during great period of dam construction from 1935 to 1975. Figure 10-15 Dams—Tennessee Valley Region The Tennessee Valley Authority manages 49 dams in the Tennessee River watershed.
Mining Underground Water Figure 10-17 Aquifer Depletion Pumping more water than natural recharge can replace lowers the water table. The drop is greatest where the water is being withdrawn, creating a cone of depression in the water table around the well site.
Mining Underground Water (cont.) Figure 10-18 Effects of Groundwater Pumping (a) A 1942 photograph of a reach of the Santa Cruz River south of Tucson, Arizona. (b) A 1989 photograph of the same site shows that the riverside trees have largely disappeared and the habitat has significantly changed. Groundwater pumping lowered the water table and created a losing stream in this area.
Saltwater Intrusion • Once the freshwater portion of the aquifer is contaminated with salt, it is difficult to reverse the situation and flush the saltwater out. • Saltwater intrusion is a problem along many parts of the U.S. coast. For example, Cape May, New Jersey, has struggled with saltwater intrusion since the late 1800s. Figure 10-19 Saltwater Intrusion Groundwater pumping can cause saltwater to move into a freshwater aquifer.
Water Quality and Pollution—a Case Study—Cholera in London • The idea that polluted water could be a source of disease is linked to the work of Dr. John Snow in London, England—he made the connection between bad well water and an 1854 cholera epidemic in parts of London through mapping (a). • When the pump handle was removed from the Broad Street well, the outbreak subsided. • (b)A replica of the original Broad Street pump was installed in 1992 to honor Snow’s pioneering scientific investigations—he’s known as the “Father of epidemiology.” Figure 10-21 Tracing the Source of a Water-Borne Disease
Natural Water Quality vs. Polluted Water • In nature water is not really pure. Why? Because water has a special chemical characteristic—it’s a dipolar molecule. Its resulting asymmetrical charge distribution allows water molecules to interact with many substances (an excellent solvent). • Because of CO2 in air,natural rainwater is slightly acidic • Many metals and other contaminants pollute water and can have negative health effects on people. Figure 10-22 Figure 10-23 Chronic Arsenic Exposure Is Harmful Taiwan and Bangladesh have well water that is naturally contaminated with arsenic. Drinking the water can result in skin lesions and skin cancer.
Is Clear Water Clean Water?—Consideration of Parasites and Microbes • Even clear mountain streams can have water quality problems such as when the microbe Giardia lamblia is present. • Giardia is the most common intestinal parasite in U.S. waters. • Some strains of E. coli bacteria or Cryptosporidium, a parasite that causes gastrointestinal distress, are also found in sewage- contaminated water—not an uncommon water-quality problem. Figure 10-24 Giardia lamblia Active form (a) and cyst form (b).
Water Pollution and Water Quality—EPA Benchmarks Figure 10-25 How a Septic System Works Wastewater and sewage collected and transferred to septic tank where bacteria digest organic material. Liquids move to drainfield and are filtered via infiltrating through soil. • EPA now sets drinking water standards for about 90 contaminants. • Most of these contaminants fall into three general categories: (1) microbes, (2) inorganic contaminants, and (3) human-made chemicals. • Municipal water treatment plants and septic systems are designed to remove harmful organisms from water after people use it.
More Water Contaminants • Inorganic contaminants— mostly metals (e.g., arsenic, lead, mercury) and nitrogen compounds; Many older pipes have lead that contaminates water • Human-made chemicals— e.g., pesticides and herbicides, gasoline with MTBE, PCBs • Sediment—increased sediment loads are a form of pollution commonly from construction sites Figure 10-26 Lead Plumbing Lead pipes were once used to bring water to homes. They can contaminate water with lead and should be replaced, as is being done for this older home.
Sources of Pollutants • Point sources Figure10-27 Point Sources of Pollution (a) Untreated wastewater discharge; (b) many feedlots are large but still considered a point source of organic contaminants.
Sources of Pollutants (cont.) • Nonpoint sources Figure 10-28 Nonpoint Sources of Pollution (a) Surface runoff through garbage; (b) widespread pesticides.
Sustaining Water Resources There are a number of ways to help sustain water resources, such as through: • Water treatment • Recycling wastewater • Conservation or using less water Figure 10-29 Municipal Water Treatment Plant Communities collect sewage and wastewater and treat it in plants before releasing it to surface water.Treatment includes removing contaminants: primary (solids, fats, floating masses), secondary (biological degradation of primary pass water), and tertiary (disinfection if needed—such as with addition of chlorine).
Recycling Wastewater • Water treatment technology is capable of making even sewage wastewater fit to drink • Successful examples—Tampa Bay area, Florida and Orange County, California. • In Tampa Bay area by 2001 reclaimed water met 42% of St. Petersburg’s needs. • Orange County, California recycled water with goal of drought-proofing its water supply with a toilet-to-tap treatment and recycling system
Conserving Water—Some Practices • Household water conservation • Using water-saving fixtures and appliances • Avoiding water-wasteful gardening • Community water conservation • Water saving agriculture—like xeriscaping in Colorado or subsurface drip irrigation systems as opposed to above-ground systems in Nebraska Figure 10-30 Xeriscaping Conserves Water Figure 10-31 Irrigation Technology Can Conserve Water
Results of Water Recycling • Water conservation is working! • Although publicly supplied water has gradually increased, irrigation and electric power generation use has leveled off. Water withdrawals have been at about 1.5 trillion liters (400–410 bill. gal.) a day since 1985. • Even in the face of increasing population, water use leveling off is attributed to water recycling in industry (especially the electric power industry) and conservation such as low-flow plumbing and low-pressure directed irrigation. Figure 10-32 Annual Water Use in the United States
SUMMARY • Water is abundant on Earth, but the water people most need, freshwater, isn’t—only 0.9% of planet’s water is fresh liquid water. • Earth’s water is a renewable and sustainable resource. Water use by people, however, has the potential to waste or degrade this resource. Appreciation of water resources can guide their sustainable use. • Misuse of water resources has effectively made them nonrenewable in some locales. • Withdrawing surface and groundwater can have environmental consequences—e.g., ecological degradation and land subsidence. • People rely largely on surface water, but groundwater is becoming increasingly important.
SUMMARY (cont.) • Groundwater pumping to excess can damage aquifers, deplete resources, cause land subsidence, and lead to saltwater intrusion such as along coasts. • Surface and groundwater are connected and use of one can affect the other. This is especially true in karst terrains. • Natural water quality varies tremendously; some natural water contains unhealthful contaminants, including dissolved metals and disease-causing microbes. • People in the U.S. use a little over 400 billion gallons (1.5 billion m3) of water daily. Electric power generation (40%) and crop irrigation (31%) are the two biggest users. Personal water use is about 80 gallons (0.3 m3) per day.