Download
1 / 52
520 likes | 539 Views
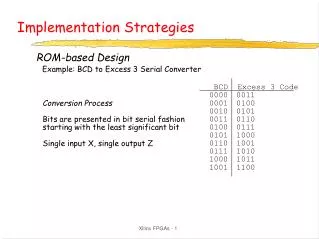
Implementation of Pairs Trading Strategies. Aldwin Shen Weishun Han Xue Maurice Tjie Zeng Fanchao Nanyang MFE FE8827: Quantitative Trading Strategies April 2011. CONTENT. 1. Introduction 2. Search Process & Criteria 3. Trading Strategies 4. Results & Analysis 5. Conclusion

E N D
Implementation of Pairs Trading Strategies Aldwin Shen Weishun Han Xue Maurice Tjie Zeng Fanchao Nanyang MFE FE8827: Quantitative Trading Strategies April 2011
CONTENT 1. Introduction 2. Search Process & Criteria 3. Trading Strategies 4. Results & Analysis 5. Conclusion 6. Reference
1. INTRODUCTION Executive Summary • Search for profitable pairs for the implementation of pair-trading strategies using the method of cointegration • Establish a search process and search criteria • Explore various pair-trading strategies • Analyze results on various trading instruments, i.e. Stocks, ETF, Stock Indices
1. INTRODUCTION Pair-Trading • Long one asset against short another (buy the cheap one and sell the expensive one) • Mean-Reversion Strategy: Spread between two highly correlated assets tends to mean revert • Stock-Picking Strategy: Eliminates systematic market risk and capitalize on mispricing in stocks • This report focus on the mean-reversion strategy
1. INTRODUCTION Stationarity & Cointegration • Construct a mean-reverting spread through linear combination • Cointegrating factor (the hedge ratio) is determined by the Johansen method • Spread is checked to be stationary using the Augmented-Dicky-Fuller test
1. INTRODUCTION Trading Instruments • Equity: 50 US stocks from different sectors: Technology, Industrials, Energy, Consumer Staples, Finances, Material, Healthcare • ETF: 13 ETFs replicating index in various countries: Dow Jones, Midcap Value, Midcap Growth, Brazil, Germany, UK, Australia. • Indices: 10 Major Indexes: DJIA, Nasdaq, S&P, DAX, CAC, STI, HSI, Nikkei, etc
2. SEARCH PROCESS & CRITERIA Search Process • Search process is run between individual asset in each instrument class via a MATLAB script • Search process is initiated with 40 days of historical data recursively from 31st Dec 2009 • If statistical test for mean reversion is significant (taking 95% confidence level), the spread is extended with 20 days • The iteration is repeated until there is no significant evidence for mean reversion
2. SEARCH PROCESS & CRITERIA Pair-Trade Criteria Factors suggesting suitable trading pairs include: • Length: Longest period showing significant evidence of mean reversion • t-statistic: More negative t-statistic signifying a more statistically significant evidence of mean reversion
3. TRADING STRATEGIES Back-testing Procedure • Trading pairs are determined from the search procedure using historical data recursively from 31st Dec 2009 • Identified trading pairs are back-tested using historical data from 1st Jan 2010 to 31st Dec 2010 to determine the cumulative profit • 3 different trading strategies are employed on the 3 different classes of trading instruments
3. TRADING STRATEGIES Trading Strategy I • Using calibrated hedge ratio & mean to trade without recalibration or rebalancing • Strategy - Buy when z < mean + 0.5 * sigma - Sell when z > mean + 0.5 * sigma • Intuition: Assumes mean reversion about the historical long-term mean exist
3. TRADING STRATEGIES Trading Strategy II • Adopts a dynamic calibration of hedge ratio & mean for a window of every 10 trading days and used to trade for the next 10 trading days with rebalancing • Strategy - Buy when z < mean + 0.5 * sigma - Sell when z > mean + 0.5 * sigma • Intuition: Assumes mean reversion about a mean with stochastic drift exist
3. TRADING STRATEGIES Trading Strategy III • Using calibrated hedge ratio to trade without recalibration or rebalancing • Strategy - Buy when zt < zt-1 + 0.5 * sigma - Sell when zt > zt-1 + 0.5 * sigma • Intuition: Assumes that mean reversion follows immediately after a price shock
4. RESULTS – Search for Cointegrated Pairs • Results on the search of cointegrated pairs for Equity Top 10 Equity Pairs based on Length
4. RESULTS – Search for Cointegrated Pairs • Results on the search of cointegrated pairs for ETF and Indices Top 5 ETF Pairs based on T-Statistics Top 5 Indices Pairs based on T-Statistics
4. RESULTS & ANALYSIS - EQUITY Trading Strategy I • GR Vs F P&L: -2.44
4. RESULTS & ANALYSIS - EQUITY Trading Strategy I • AMZN Vs NYX P&L: 12.63
4. RESULTS & ANALYSIS - EQUITY Trading Strategy I • CVX Vs LM P&L: 9.63
4. RESULTS & ANALYSIS - EQUITY Trading Strategy I: Analysis • Spread is not mean reverting around the historical long-term mean. • A trading position is entered into and the position is held for prolonged period as there is no exit signal. • Not a feasible trading strategy.
4. RESULTS & ANALYSIS - EQUITY Trading Strategy II • GR Vs F P&L: 20.57
4. RESULTS & ANALYSIS - EQUITY Trading Strategy II • AMZN Vs NYX P&L: 56.80
4. RESULTS & ANALYSIS - EQUITY Trading Strategy II • CVX Vs LM P&L: 5.31
4. RESULTS & ANALYSIS - EQUITY Trading Strategy II: Analysis • Shows a higher trading activity compared to Strategy I and is consistently profitable for the pairs analyzed. • Apparently the most appropriate pair-trading strategy for Equity.
4. RESULTS & ANALYSIS - EQUITY Trading Strategy III • GR Vs F P&L: 44.10
4. RESULTS & ANALYSIS - EQUITY Trading Strategy III • AMZN Vs NYX P&L: -40.89
4. RESULTS & ANALYSIS - EQUITY Trading Strategy III • CVX Vs LM P&L: 0.58
4. RESULTS & ANALYSIS - EQUITY Trading Strategy III: Analysis • Displays inconsistent performance across the pairs analyzed. There is a possibility of huge profits as well as huge losses. • This implies that there is no specific reaction to price shocks for equity pair-trading.
4. RESULTS & ANALYSIS - ETF Trading Strategy I • MSCI Pac Ex-Jap Vs MSCI UK P&L: -1.06
4. RESULTS & ANALYSIS - ETF Trading Strategy I • iShares Aust Index Vs MSCI UK P&L: 6.55
4. RESULTS & ANALYSIS - ETF Trading Strategy I: Analysis • Spread is not mean reverting around the historical long-term mean. • A trading position is entered into and the position is held for prolonged period with few exit signals. • Trading activity is more as compared to Equity. • Not a feasible trading strategy.
4. RESULTS & ANALYSIS - ETF Trading Strategy II • MSCI Pac Ex-Jap Vs MSCI UK P&L: 15.82
4. RESULTS & ANALYSIS - ETF Trading Strategy II • iShares Aust Index Vs MSCI UK P&L: 9.70
4. RESULTS & ANALYSIS - ETF Trading Strategy II: Analysis • Shows a higher trading activity compared to Strategy I and is consistently profitable for the pairs analyzed. • It is an appropriate strategy for ETF.
4. RESULTS & ANALYSIS - ETF Trading Strategy III • MSCI Pac Ex-Jap Vs MSCI UK P&L: 20.76
4. RESULTS & ANALYSIS - ETF Trading Strategy III • iShares Aust Index Vs MSCI UK P&L: 10.61
4. RESULTS & ANALYSIS - ETF Trading Strategy III: Analysis • Shows a higher trading activity compared to Strategy I and is consistently profitable for the pairs analyzed. • It is an appropriate strategy for ETF. • This implies that ETF pair trades mean-revert closely after price shocks.
4. RESULTS & ANALYSIS - INDICES Trading Strategy I • DJIA Vs NIKKEI 225 P&L: 2948.51
4. RESULTS & ANALYSIS - INDICES Trading Strategy I • FTSE 100 Vs NIKKEI 225 P&L: 425.30
4. RESULTS & ANALYSIS - INDICES Trading Strategy I • CAC 40 Vs NIKKEI 225 P&L: 425.30
4. RESULTS & ANALYSIS - INDICES Trading Strategy I: Analysis • Spread is not mean reverting around the historical long-term mean. • A trading position is entered into and the position is held for prolonged period with few exit signals. • Not a feasible trading strategy.
4. RESULTS & ANALYSIS - INDICES Trading Strategy II • DJIA Vs NIKKEI 225 P&L: 2002.62
4. RESULTS & ANALYSIS - INDICES Trading Strategy II • FTSE 100 Vs NIKKEI 225 P&L: 1153.89
4. RESULTS & ANALYSIS - INDICES Trading Strategy II • CAC 40 Vs NIKKEI 225 P&L: 813.38
4. RESULTS & ANALYSIS - INDICES Trading Strategy II: Analysis • Shows a higher trading activity compared to Strategy I and is consistently profitable for the pairs analyzed. • Profits analyzed may not be accurate as the pairs are analyzed based on the spot indices and not index futures and tick value is not accounted for. However, it gives a clear indication of relative performance amongst the trading strategies. • It is an appropriate strategy for Indices.
4. RESULTS & ANALYSIS - INDICES Trading Strategy III • DJIA Vs NIKKEI 225 P&L: 6471.68
4. RESULTS & ANALYSIS - INDICES Trading Strategy III • FTSE 100 Vs NIKKEI 225 P&L: 2044.30
4. RESULTS & ANALYSIS - INDICES Trading Strategy III • CAC 40 Vs NIKKEI 225 P&L: 2108.45
4. RESULTS & ANALYSIS - INDICES Trading Strategy III: Analysis • Shows a higher trading activity compared to Strategy I and is consistently profitable for the pairs analyzed. • Apparently this is the most profitable strategy for indices. • This implies that Indices pair trades mean-revert closely after price shocks.
5. CONCLUSION • The pair trading search process is most easily applicable to Equity as there are more individual assets to compare and easier to arrive at profitable pairs. • Using the length and t-statistic of mean reversion from the search procedure is a useful indication of profitable pairs for trading. • Pair trading performance for ETF and Indices are more consistent as compared to that of Equity.
5. CONCLUSION • Trading Strategy I is not an appropriate trading strategy for the classes of trading instruments analyzed as there exists a stochastic drift away from the historical long-term mean. • Trading Strategy II is the most appropriate trading strategy for Equity. • Trading Strategy II & III are equally appropriate for ETF pair trading. • Trading Strategy III is the most profitable trading strategy for Indices however Trading Strategy is appropriate as well.
6. REFERENCE • Øyvind Foshaug. Implementation of Pairs Trading Strategies. Faculty of Science. Koortweg- de Vries Institute for Mathematics. Master of Science Thesis. 2010. • Ernest Chan. Quantitative Trading: How to Build Your Own Algorithmic Trading Business. • Haksun Li. Lecture Materials “Quantitative Trading Strategies” course in M.Sc Financial Engineering, NTU. 2011