Download
1 / 25
250 likes | 308 Views
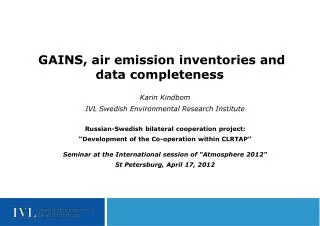
Assembling Emission Inventories of Primary Carbonaceous Aerosols.

E N D
Assembling Emission Inventories of Primary Carbonaceous Aerosols D.G. Streets1, T.C. Bond2, G.R. Carmichael3, J.-H. Woo3, and Z. Klimont41Argonne National Laboratory2University of Illinois at Urbana-Champaign3University of Iowa4International Institute for Applied Systems Analysis, AustriaNARSTO Emission Inventory WorkshopUniversity of Texas, AustinOctober 14-17, 2003
Recent work by Hansen, Jacobson, and others suggests that BC is a very importantgreenhouse species Net forcing = 1.6 +/- 1.1 W/m2
“Our analysis of climate forcings suggests, as a strategy to slow global warming, an alternative scenario focused on reducing non-CO2 GHGs and black carbon (soot) aerosols.… (R)eductions in tropospheric ozone and black carbon would not only improve local health and agricultural productivity but also benefit global climate and air quality.” J. Hansen, M. Sato, R. Ruedy, A. Lacis, and V. Oinas, Global warming in the twenty-first century: an alternative scenario, Proceedings of the National Academy of Sciences, 97, 9875-9880, 2000 James Hansen’s “Alternative” Scenario(released August 29, 2000)
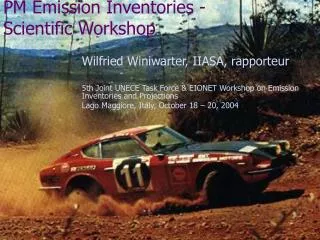
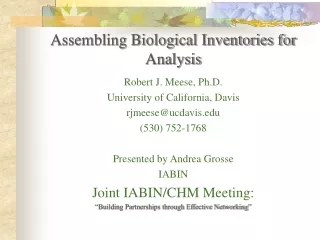
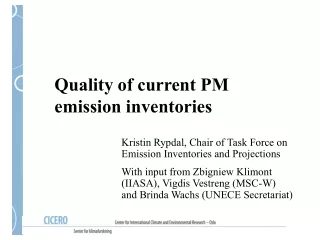
The biggest source of BC is residential burning of coal and biofuels in developing countries (not power plants) (photograph courtesy of Bob Finkelman, USGS)
they are based on old fuel use data (1984) they use inappropriate emission factors, especially for large coal combustors they do not consider technology variations in sufficient detail they do not treat biofuels carefully they do not treat residential stoves carefully *Cooke and Wilson (fossil fuels only): JGR, 101, 19395-19409, 1996 Cooke et al. (fossil fuels only): JGR, 104, 22137-22162, 1999 Liousse et al. (biofuels and open biomass): JGR, 101, 19411-19432, 1996 There are problems with the BC and OC emission inventories* that are in common use by global modelers today
Methodology for this new 1996 BC/OC Emission Inventory The model has 112 fuel/technology combinations for each country
EFBC = EFPM x F1.0 x FBC x Fcont EFOC = EFPM x F1.0 x FOC x Fcont where: EFPM = bulk particulate emission factor (usually PM10) F1.0 = fraction of the emissions that are < 1 μm in diameter FBC, FOC = fraction of the particulate matter that is carbon Fcont = fraction of the fine PM that penetrates any control device that might be installed Calculation of BC and OC emission factors(g kg-1 of fuel burned)
Fuel/Technology EFPM F1.0 FBC FOC Fcont Biofuel stove 10 0.85 0.1 0.6 1.0 Biofuel stoker 2.2 0.86 0.05 0.2 0.4-1.0 Briquettes 2.5 0.25 0.01 0.02 0.3-1.0 Brown coal stoker 17 0.11 0.05 0.66 0.06-1.0 Hard coal stoker 4.2 0.33 0.1 0.02 0.05-1.0 Hard coal PC 12 0.09 0.006 0 0.05-0.9 Heavy fuel oil 1.1 0.45 0.08 0.03 0.13-1.0 Kerosene stove 0.9 1.0 0.13 0.1 1.0 Natural gas 0.002 1.0 0.06 0.5 1.0 Solid waste open burn 30 0.5 0.37 0.37 1.0 Examples of EFPM (g kg-1) and fractions used to develop the BC and OC emission factors
Fuel Residential Industry Power Transport Wood 0.3-1.4 0.08-0.55 0.044 -- Ag waste 1.0 -- -- -- Briquettes 0.15 0.005 0.011 -- Brown coal 0.18 0.001-0.015 0-0.002 -- Hard coal 0.89-5.4 0.007-1.2 0.008-1.2 3.0 Diesel oil 0.06-4.0 3.4-4.4 0.25 1.3-3.6 Gasoline, etc. 0.9 0.14 -- 0.08-0.43 Natural gas 0 0 0 0 Solid waste 4.2 0.013 0.013 -- Open biomass 0.48 (savanna) 0.69 (crop residues) 0.56-0.61 (forests) burning Examples of calculated EFBC (g kg-1)for various fuels and sectors
Residential sector (fires/stoves) rural population Open waste burning urban population Agricultural diesel use agricultural landcover International shipping shipping lanes Forest burning forest landcover* Savanna burning savanna landcover* Ag waste burning agricultural landcover* *Adjusted by AVHRR fire counts for 1999-2000 Emissions are gridded using total population distribution,except for the following cases that use other proxies:
Global distribution of BC emissions from fuel combustion (ng m-2 sec-1)
Global distribution of BC emissions from open biomass burning (ng m-2 sec-1)
Global distribution of OC emissions from fuel combustion (ng m-2 sec-1)
Global distribution of OC emissions from open biomass burning (ng m-2 sec-1)
Fuel/Sector This work Previous84 Previous96 Coal/power generation 7 1594 Coal/industrial 610 2840 1181 Coal/residential 517 761 Diesel/on-road 907 1917 Diesel/residential 98 1710 369 Diesel/off-road 682 696 Gasoline/transport 108 41 Wood/residential 877 1921 Dung/residential 208 1000 417 Ag waste/residential 393 90 Open burning/crop residues 327 530 356 Open burning/savanna 1726 2170 2912 Open burning/forests 1244 1930 2980 Other 354 447 Total 8058 10700 15682 Comparison of BC emissions (Gg yr-1) in this inventorywith Cooke et al. (1999) & Liousse et al. (1996),as used in many global model studies
Reasons for major differences between this inventory and previous work (Cooke et al., 1999; Liousse et al., 1996) ΔPrev96 ~1500 Gg ~250 Gg ~1000 Gg ~1000 Gg ~3000 Gg Reason PM was assumed to be 25% BC, 25% OC. No measurements support this assertion. PM is mostly mineral matter. Engine emission factors were applied to residential use of diesel. These are not appropriate for home furnaces. BC emission factor assumed to be 10 g/kg in developing countries. No measurements support this value – even studies targeting polluting vehicles in developing countries. PM emission factors from fireplace combustion were used for cooking stoves. Measurements show that cookstove emission factors are much lower. New emission factors from Andreae and Merlet (2001) Fuel/Sector Coal/Power generation Diesel/Residential Diesel/On-road Wood/residential Open biomass burning
IPCC scenario specifications Emission Factors (EF) for BC Growth Factors from IPCC 1996 IEA Energy Statistics Technology Splits (X) BC emitted Projected Fuel Use by Sector in 2000/2030 Fuel Use by Sector, Technology in 2000/2030 1996 Fuel Use by Sector OC emitted Emission Factors (EF) for OC EFOC = EFPM * F1.0 * FOC * Fcont We are developing a capability to develop emissions for past and future years, initially 2000 and 2030, later, maybe, 1850-2100 (!?) 112 fuel/tech combinations x 17 World Regions
The BC/OC regional model begins by importing energy use from international statistics or global energy forecasts (Gg fuel)
Technology splits reflect scenario, regional, and technology differences Big issue is the rate of penetration of better technologies in the future (or mix of technologies in the past)
Work in progress suggests that energy use will drive emissions upin the future, while improvements in technology performance will drive emissions down. It is likely that the net result will be stability or a decline in BC emissions in the future, depending on scenario (stay tuned) Technology improvements Small decline between 1996 and 2000 From Bond et al global inventory
Two urgent needs are to do more source testing in the developing world and to survey emitting sources Representativeness of entire population of sources Typical operating practices Typical fuels and fuel characteristics Relationship to similar sources in the developed world Daily and seasonal operating cycles
ENERGY USE BIOMASS BURNING BC EMISSION FACTORS SOURCE TESTING BC EMISSIONS BC ANALYSIS METHODS MONITORING CAMPAIGNS ATMOSPHERIC MODELING Often, [Global, India, China, …] CALCULATED BC CONCENTRATIONS OBSERVED BC CONCENTRATIONS Another need is to reconcile conflicting views about BClaboratory measurements, field observations, and model results
“A Technology-Based Global Inventory of Black and Organic Carbon Emissions from Combustion” T.C. Bond, D.G. Streets, K.F. Yarber, S.M. Nelson, J.-H. Woo, and Z. Klimont in review Journal of Geophysical Research, 2003 (available from Tami Bond at yark@uiuc.edu) Documentation of the 1996 inventory is availablein the form of the following paper: