Download
1 / 18
180 likes | 204 Views
Explore methods, strengths, and weaknesses of emission inventories in North America, learn about the consequences of errors, and discover strategies for improvement recommended by NARSTO. Enhance your understanding to achieve effective air quality management.

E N D
Improving Emission Inventories inNorth America NERAM V October 16, 2006 William T. Pennell NARSTO Management Coordinator
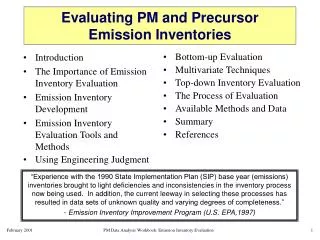
Outline • Emission Inventory Development • Methods for Evaluation • Strengths and Weaknesses of North American Emission Inventories • Actions for Addressing Weaknesses • Costs of Emission Inventory Development and Improvement
First of All, What Is NARSTO? • A multi-stakeholder, public-private partnership among government, the private sector, and academia throughout Canada, Mexico, and the United States that collaborates to improve air quality management science in North America. • NARSTO has recently completed an assessment of emission inventories for the three countries of North America. • This presentation is based on that assessment.
How Are Emission InventoriesConstructed? E = EF A (1 - ER) Where E are the emissions (e.g., kg/hr or tonnes/yr) EF is the emission factor (mass emitted per unit process variable) A is the related process variable (e.g., mass of fuel consumed ER is an emission reduction factor (1 > ER > 0) But this simple relationship hides many complexities!
How Are Uncertainties Estimated? • Top-down methods • Comparison with ambient measurements • Alternative estimation using different activity factors • Inverse modeling • Bottom-up methods • Direct measurements • Model uncertainty analysis • Model sensitivity analysis
Consequences of Errors? Consequences of errors in emission inventories (as well as lack of knowledge of their uncertainties) can range from wrongly identifying a pollutant that should be controlled to overlooking source categories whose control could result in more cost-effective emission reductions.
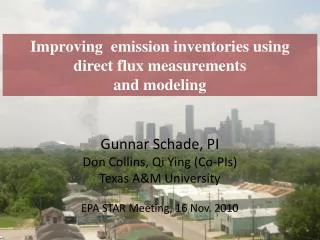
An Example: Houston, Texas • Houston is currently in non-attainment for ozone NAAQS. • An initial proposed management plan, based on then-current inventories, proposed reducing NOx emissions by 90 percent. • However, a subsequent field experiment discovered significant sources of highly reactive VOCs not included in the inventory. • Subsequent modeling indicated a revised strategy of VOC reductions coupled with 80 percent NOx reductions. • Economic modeling suggested substantial economic savings with the revised strategy (10 years after implementation, 65,000 fewer jobs and a regional economy $9B smaller with 90% NOx reduction).
Strengths and Weaknesses of Current North American Inventories Strengths • Good understanding of major point sources • Emissions models have continuously improved • Importance of natural emissions recognized • Quantitative estimates of emissions available for many source categories • Improved understanding of relative importance of source categories • Emission trends can be tracked
Strengths and Weaknesses of Current North American Inventories Weaknesses • Significant uncertainties in mobile source inventories (e.g., speciation of VOCs, CO emissions, trends in NOx) • Emissions for many important categories are uncertain (e.g., fine PM, biogenics, ammonia, air toxics, etc.) • Quality assurance is uneven • Estimates often based on insufficient sample sizes • Temporal and spatial resolution inadequate for modeling • Speciation profiles out of date • Inventories not timely • Differences in methods and standards between countries complicate joint air quality management
What Is The Case for Improving Emission Inventories? • Current inventories may support today’s needs, but they have significant shortcomings • As emissions from major sources decline, emissions from sources that are more difficult to characterize will become more important • Errors in emission estimates from these sources will have increasing consequences • These consequences can result in ineffective air quality management actions that affect the credibility of the air quality management system.
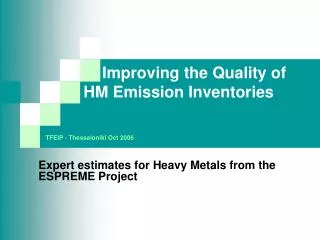
Key Findings And Recommendations 1. Focus immediate attention on reducing uncertainties for key under-characterized sources • Fine particles and their precursors • Toxic and hazardous air pollutants • Onroad motor vehicles • Agricultural sources, especially ammonia • Biogenic sources • Petrochemical and other industrial facilities • Offroad mobile sources • Open biomass burning • Residential wood combustion • Paved and unpaved road dust
Within This Focus • Improve Emission Inventory Speciation Estimates • Improve Existing and Develop New Emission Inventory Tools • Quantify and Report Uncertainty • Increase Emission Inventory Compatibility and Comparability • Improve User Accessibility • Improve Timeliness • Assess and Improve Emission Projections
Implementation Issues To achieve these recommendations • They must be addressed over the next 10 years • However, significant additional resources -- on the order of 2-10 times current expenditures -- will be required • Long-term commitments to improving tools and techniques and for increasing the emission inventory workforce are necessary • Cooperation, collaboration and strong backing from all stakeholders is essential
An Initial (3-5 Year) Action PlanFor Canada • Improve the emission inventory for PM2.5 and its precursors • Improve speciation profiles of PM and VOCs • Improve point source emission estimates • Improve the timeliness of the dissemination of emission inventory trends and projections. • Engage appropriate stakeholder groups to develop a national strategy to implement emission inventory improvements Estimated cost? About $6M/yr. (US) for the next 5 years.
An Initial (3-5 Year) Action PlanFor The United States • Enhance the emission inventories and associated tools (e.g., SPECIATE) for PM2.5 and its precursors • Establish emission inventory reporting requirements for hazardous air pollutants and integrate these data into the NEI. • Improve the capacity of state, local, and tribal agencies to develop inventories needed to meet regulatory requirements. • On a regional basis, engage appropriate stakeholder groups to develop action plans to implement the full range of recommendations. • Increase support of research to develop and improve emission inventories. Estimated Cost? Approximately $35M/year above current expenditures, or about 0.2% of the current annual cost of CAA compliance.
An Initial (3-5 Year) Action PlanFor Mexico • Complete the National Emission Inventory for Mexico (released September 2006) • Develop and implement a communications strategy to disseminate results of the NEI • Develop and fulfill requirements at the national level to enable emission inventory updates on a three-year cycle • Build emission inventory development capacity in state environmental agencies • Expand technical capabilities in Mexican agencies • Continue to improve inventory development capabilities through partnerships with Canada and the U.S. • Conduct direct emission measurements and develop Mexico-specific emission factors • Develop a national data system • Increase human resources at federal and local levels Estimated Cost? About $7M/yr. (U.S.) for the next 3-5 years.
Summary • Accurate emission inventories are the foundation of effective air quality management. • Uncertainties in emission inventories must be addressed to avoid the potentially significant consequences of inaccurate information. • NARSTO Emission Inventory Assessment provides a road map for improving emission inventories that will improve quality, enhance timeliness, and increase the cost-effectiveness of air quality management programs. • Significant investment by government agencies and the private sector is needed. • For more information and a PDF version of the assessment, go to: http://www.narsto.org. Also see August 2006 issue of JAWMA.