The Market Research Process: New Product Development
240 likes | 780 Views
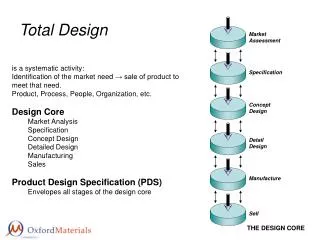
The Market Research Process: New Product Development . Patterns of Entrepreneurship Analytical Tools. New Product Development Process. Business Strategy. Product/service development. Idea generation. Idea screening and evaluation. Product/service testing. Business analysis. Market entry.

The Market Research Process: New Product Development
E N D
Presentation Transcript
The Market Research Process:New Product Development Patterns of Entrepreneurship Analytical Tools
New Product Development Process Business Strategy Product/service development Idea generation Idea screening and evaluation Product/service testing Business analysis Market entry The first part of this presentation concentrates on Idea Screening and Evaluation and Product/Service Development
Market Research Process Define problem and research objectives Develop research plan Collect Information Analyze Information Present Findings
Primary Research: Investigating the “original source” of data, interviewing customers/prospects Focus groups: gathering of 6-10 pre-selected respondents to discuss product or service; candid discussions encouraged; sample is too small to be projected; objective is exploratory Survey Research: Usually randomly selected (with parameters) sample to project to larger population in question; survey can contain open-ended and closed-ended questions; objective to learn perceptions, satisfaction levels, etc. Primary Research: Continued Experimental Research:Most scientifically valid; If you can develop a version of your product/service, select different groups of subjects, control for external variables and note differences. Comparable to a “test run” before product/service enters market. Research Tool Kit
Secondary Research: Investigating research findings already written Sources - Government Publications Statistical Abstract of US (demographics, economics and social data) County and City Data Book (relevant stats broken down by county and city) U.S. Industrial Outlook (projections of industrial activity by industry including production, sales, shipments, etc.) Other government publications like Census of Population, Federal Reserve Bulletin, Survey of Current Business More Sources - Periodicals Standard and Poor’s Industry Surveys (provide updated stats and analyses of industries) Moody’s Manuals (financial data and names of executives) Marketing journals like Journal of Marketing, Journal of Marketing Research, Journal of Consumer Research Trade Magazines including Direct, BrandWeek, Sales and Marketing Management Business Magazines like Harvard Business Review and The Economist Secondary Research Resources
Quantitative Sources - Commercial Data A.C Nielsen Company Data (Data on products sold in retail, supermarket scanner, television and others) MRCA Information Services (Data on weekly family purchases of consumer products) Simmons Market Research Bureau (Annual reports covering verticals by demographics and brand preferences) Research Houses Sell data to subscribers useful to construct models for forecasting demand Audit Bureau of Circulation Arbitron Audits and Surveys Dun and Bradstreet National Family Opinion Standard Rate and Data Service Secondary Research Resources
Statistical Tools • Unlikely you will use most of these techniques; list presented below for your general knowledge • Other modules on Wiley web site (companion site) offer interactive exercises • Statistical tools: • Multiple Regression: Estimating “best fitting” equation showing how value of dependent variable varies with changing values in number of independent variables • Example: Estimate how unit sales are influenced by ad expenditures, price and competitors moves • Discriminant Analysis: Classifying persons into two or more categories • Example: Reveal variables that discriminate between loyal and non-loyal customers • Conjoint Analysis: Ranking of preferences for different offers to identify relative importance of attributes to customers • Example: Identify most important attributes (price, warranty, service and brand) and tradeoffs involved for end-users of a laptop computer manufacturer
Statistical Tools (Cont’d) • Cluster Analysis: Separate data into specified number of mutually exclusive groups such that groups are homogeneous on chosen factors • Example: Create five different types of technology consumers based upon purchasing behavior and recency of purchase relative to product release date; categories may be “earlier adopters,” or “laggards” etc. • Multidimensional Scaling: Produce “perceptual maps” of competitive products or brands to measure how they stack up among each other • Example: Find out how a particular brand is perceived versus other brands on “trust,” “reliability,” and “quality”
Assessing Market Demand • Forecasting demand crucial for determining potential of new business idea • Market demand function depends on external factors like industry marketing expenditures, demographics or economic conditions • Market potential is the limit approached by market demand as industry marketing expenditures are maximized for a given economic environment (prosperity, recession) • Note: Market potential is conditional to its economic environment • Total market potential is the maximum amount of sales available to all firms in an industry during a given period. Q = nqp where: Q = total market potential n = number of buyers for product under given assumptions q = quantity purchased by average buyer p = price of an average unit • n is often difficult to estimate; one technique is to start with population and sequentially remove segments outside of product’s market
Assessing Market Demand (Cont’d) • Another method for calculating total market potential: chain-ratio • Multiplying base number by several adjusting percentages • Example: TMP for hair shampoo for dry hair for menPopulation x .5 (percentage of males) x personal discretionary income per capita x average percentage of discretionary income spent on personal products for men x average percentage of amount spent on personal products that is spent on hair shampoo x expected percentage of amount spent on shampoo that will be spent on shampoo for dry hair • Some of the above data are available in the secondary sources listed in an earlier slide • Sum of competitors’ sales • Industry trade association will often collect and publish total industry sales • More expensive option if needed: data research house like A.C. Nielsen
New Product Development Process Business Strategy Product/service development Idea generation Idea screening and evaluation Product/service testing Business analysis Market entry The second part of this presentation concentrates on Market Entry, including the 4 Ps.
Expansion Strategies • Expansion opportunities – there are four basic strategies: • Sell more existing products to existing customers (market penetration) • Sell existing products to new customers (market development) • Sell new products to existing customers (product development) • Sell new products to new customers (diversification)
ALTERNATIVE MARKETING CHANNELS Marketing plan should specify where in supply chain business is marketing. Which of the above is the customer?
Design stages Decision criteria Identification Intensity of distribution of channel Access to end-user alternatives Prevailing distribution practices Necessary activities and functions Revenue-cost analysis Evaluation and Time horizon for development selection of Control considerations channel(s) to Legal constraints be used Channel availability Market coverage Selection Capability of channel Intermediary’s needs participants Functions provided Availability Channel design decisions and decision criteria
PROMOTION MIX TOOLS Advertising Personal selling Print ads In-person sales Broadcast ads presentations Billboard ads Telemarketing Packaging logos and information The promotion mix Sales promotion Publicity Print media Games, contests Free samples news stories Trade shows Broadcast media news stories Couponing Trading stamps Annual reports Price promotion Speeches by Signs and displays employees
Sales Personal promotion Advertising Publicity selling Criteria Cost per Very Very Low Low Audience member low high Poor Very Confined to Good Moderate to good good target markets Deliver a Poor Poor to Very Poor Complicated message to good good good Low to Very Interchange None None moderate good with audiences Moderate Credibility Low Low High to high PROMOTION TOOL’S STRENGTHS AND WEAKNESSES