Download
1 / 14
140 likes | 239 Views
Georgia Secondary and Local Roads Project. “Reconciling Growth and Poverty Impact Objectives in Rural Roads Selection”. Situation in Rural Roads Sector in Georgia. Traffic volumes a fraction of that in the early 1990s Extreme rural poverty (30%) linked to collapsed infrastructure

E N D
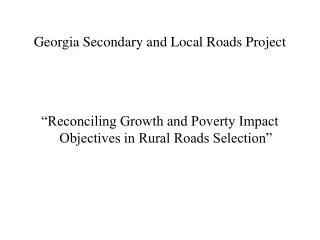
Georgia Secondary and Local Roads Project “Reconciling Growth and Poverty Impact Objectives in Rural Roads Selection”
Situation in Rural Roads Sector in Georgia • Traffic volumes a fraction of that in the early 1990s • Extreme rural poverty (30%) linked to collapsed infrastructure • Roads in very poor condition – 15 kmph • High construction costs - $100k-$50k/km • Negligible maintenance – expenditures of about $600/km – with most of it spent on the primary network • Roads Department influenced by political and geo-political considerations in road selection.
Georgia Secondary and Local Roads Project Location of the 16 Roads to be Evaluated
The Selection Problem • Utility of standard approaches (HDM/RED) limited due to uncertainty on traffic – present poor indicator of future. • Need to pay attention to poverty AND growth impacts. • No real basis for weighting growth vs poverty in a multi-criteria function. • Rather than rank projects, need to separate “good” from “not as good” projects – i.e. separate wheat from chaff.
Growth and Poverty Impact Possibilities Frontier • Growth characterized as NPV(@12%)/$1000 invested • Poverty impact as #Poor Served/$1000 invested • Both indicators are better the higher their value • Each road plotted on scatter diagram of growth vs poverty • In the scatter plot, points furthest from the origin have high “NPV/$1000” and/or high “Poor/$1000” • Points near the origin considered inferior to points farther away. • Points farthest away form the “Growth and Poverty Impact Possibilities Frontier”
Expert Opinion Survey • To address the high risk in traffic forecasts • Four experts (2 agriculture, 1 tourism, 1 transport) • Each road rated on a scale of 1-10 for agricultural potential and off-farm employment opportunity • Results based on NPV were checked against ratings by the experts • Out of 8 roads selected using NPV, 5 also emerged in the expert opinion
SH043 SH068 SH022 SH002 SH031 SH006 SH008 SH014 SH030 102 353
SH031 SH030 SH043 SH002 SH068 SH022 SH006 SH014 SH008 SH008 102 353
NPV/$1000 + 50 X Poor/$1000 = 500 NPV/$1000 + 300 X Poor/$1000 = 3000
Participatory Input to Selection • As a final check we visited roads in the first year program • Conducted a meeting of local representatives at each place • The value of this was clearly demonstrated in the case of Tianeti road