Download
1 / 22
220 likes | 386 Views
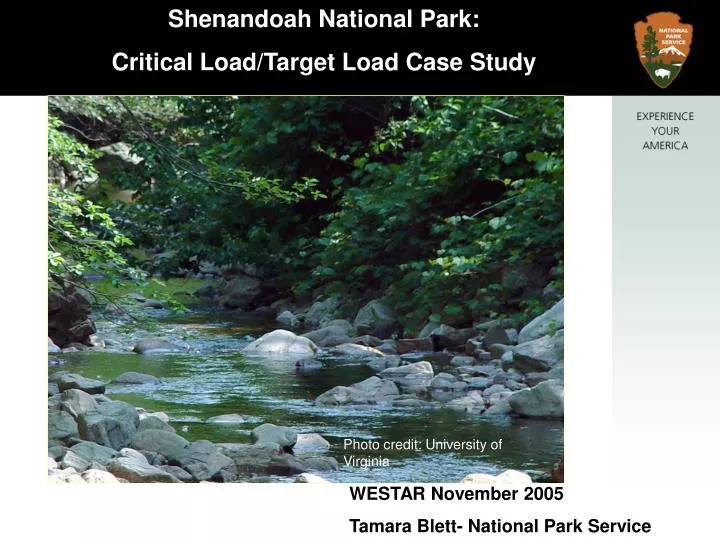
Shenandoah National Park: Critical Load/Target Load Case Study. Photo credit: University of Virginia. WESTAR November 2005 Tamara Blett- National Park Service. Shenandoah National Park: Critical Load/Target Load Case Study. Focus on:

E N D
Shenandoah National Park: Critical Load/Target Load Case Study Photo credit: University of Virginia WESTAR November 2005 Tamara Blett- National Park Service
Shenandoah National Park: Critical Load/Target Load Case Study Focus on: 1.Use of ecosystem and deposition data in critical loads development for aquatic ecosystems 2. Selection of critical loads and target loads from modeling outputs 3. Why land health goals are needed before each critical load or target load is developed
Chronic acidification Episodic acidification Changes in soil productivity Aquatic plant species shifts from fertilization Load (kg/ ha /yr) No such thing as a “generic” critical load for a park or wilderness area…. A CL is the loading at which SOMETHING happens in an ecosystem. Defining which SOMETHING is relevant to the FLM area is a critical part of CL development … Forest dieback
Shenandoah National Park: Critical Load/Target Load Case Study Critical load: The quantitative estimate of an exposure to one or more pollutants below whichsignificant harmful effects on specified sensitive elements of the environment do not occur according to present knowledge.”
WESTAR FRAMEWORK WORKGROUP QUESTION: What are the AQRVs that should be addressed and what are the criteria for addressing them? 3 types of critical loads development efforts: • N & S acidification effects to aquatic ecosystems (via water chemistry thresholds) • N & S acidification effects on forest ecosystems (via soil chemistry thresholds) • N fertilization effects on aquatic and terrestrial plant and animal species (via species shifts) Simulation modeling Field data and experiments
Which AQRVs to use in CL development? • FLMs have the responsibility to identify our AQRVs and develop strategies to protect them • FLMs will protect most sensitive resources from unacceptable change • FLMs will base critical loads on best available science and revise and update as appropriate
Shenandoah National Park: Use of Ecosystem and Deposition Data in CL Development Current Deposition Loadings: • Shenandoah National Park has long experienced high deposition loadings. • Sulfur deposition (rather than N) is the primary cause of acidification of park soils and waters.
Photo credit: University of Virginia Stream chemistry sampling tells us which aquatic plants and animals can grow, survive, reproduce… and which cannot
Park streams are highly impacted by deposition: • Pre-1900, all Shenandoah streams had ANC>50 ueq/l (levels that sustain healthy aquatic biota) • In a 1992 survey, about half of the most sensitive streams had ANC<0, with lethal effects on brook trout probable • The rest had ANC between 0-20, with sub-lethal or lethal effects possible. • Modeling suggests that most sensitive • streams in the park have lost up to 4 fish species
WESTAR FRAMEWORK WORKGROUP QUESTION: Are there simple endpoints (like visibility thresholds) that can be used to assess effects? Aquatic ecosystems Desired goals: healthy biota (invertebrates, fish, aquatic plants, etc.) Measurement endpoints: ANC, pH, base cations, Al • ANC of 50-100 ueq/l considered acid-sensitive but capable of supporting healthy biota • ANC < 50 ueq/l sensitive to acidification; potential effects to biota • ANC < 20 ueq/l: episodically acidic, sub-lethal or lethal effects on biota • ANC < 0 ueq/l: chronically acidic, lethal effects on many biota FLM selects desired endpoints and effects
small decrease in species richness* loss of acid sensitive species* Loss of additional fish / invertebrates* metals soluble free ionic form Toxic! *Baker et al. 1990 Acidified* Extremely Acid Sensitive* Acid Sensitive* Healthy! Less soil buffering capacity More soil buffering capacity
Deposition accumulates in soils over time: • Soils soak up pollutants like a sponge over time • Excess sulfur accumulates in soils, acidic conditions develop, which then strip beneficial nutrients from the soils and weaken plants • Acidic compounds “use up” the buffering ability of soils and surface waters.
Development of Critical load or Target load Critical load: “The quantitative estimate of an exposure to one or more pollutants below whichsignificant harmful effects on specified sensitive elements of the environment do not occur according to present knowledge.” (Nilsson and Grennfelt 1988) Significant harmful effects from deposition have been documented in Shenandoah streams BUT they are above the critical load… and we don’t know the loading at which they first began……
Now the more relevant question is: what loading is desired to achieve to meet ecosystem goals? • Target load: • The level of exposure to one or more pollutants that results in an acceptable level of resource protection; may be based on political, economic, or temporal considerations.
Surface Water Effects Thresholds Used to Develop Critical & Target Loads Chronic acidification <0 ueq/L Episodic acidification <20 ueq/L Healthy aquatic biota >50ueq/L Changes in soil & water chemistry Load (kg/ ha /yr) Critical loads are defined for specific indicators and effects.
Water quality dataused in modeling CL/TL 14 streams in Shenandoah have sufficient water chemistry data for calibrating the MAGIC* model. Streams were routinely sampled for 12 yrs as part of the SHEN Watershed Study and the Virginia Trout Stream Sensitivity Study. Of the 14 streams, only 5 were on very sensitive (siliciclastic) bedrock; the remainder were relatively insensitive. *Modeling for Acidification of Groundwater In Catchments
Deposition reduction Current Re-evaluate; adjust Glide path • Set interim target • Establish glide path • Re-evaluate periodically Deposition (kg/ha/yr) Interim Target Natural Time
Developing Interim Target Loads • FLM sets management goal: “restore healthy ecosystems (ANC=50) to Shenandoah NP” • Scientists may/may not be able to determine the actual CL (the deposition loading at which Shenandoah ecosystems became unhealthy in the past) • Target loads to achieve ANC of 50 in 50 years ranges from 0-4 kgS/ha/yr (depending on individual stream). • Models (MAGIC and others) used to determine how deposition reductions could improve stream chemistry conditions • Deposition in Shenandoah is now ~10 kg S/ha/yr. • States (w/FLM involvement) develop Interim Target Loads to set improvement goals over time (similar to a glide path for visibility improvement).
Current vs. 40% Reduction 60 50 40 30 % of brook trout streams 20 10 0 Current (1991) Future (2041) Not acidic (Suitable for brook trout) Chronically Acidic (Unsuitable for brook trout) Shenandoah researchers project that streams will continue to acidify in the future due to S and N deposition, even with projected reductions in SO2 emissions.
So…. May need longer time frames for recovery when developing target loads AND May need to consider more stringent emissions reductions if ecosystem goals are to be met to protect parks for “future generations” Eastern US sites are worse off… there is still time to avoid major ecosystem damage in the west if deposition levels are reduced.
Conclusions 1.Need good ecosystem data as model inputs to develop critical loads/target loads modeling estimates 2. Critical loads may be difficult to determine where already exceeded (unless we know when they were first exceeded and what the deposition was in that time and place) 3. Target loads can be established via modeling for areas where CL have been exceeded 4. Defining ecosystem health and recovery goals is crucial before using modeled critical load or target load outputs.