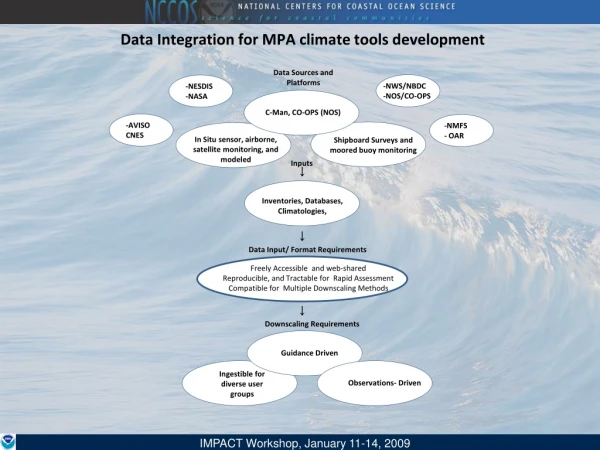
Data Integration for MPA climate tools development
This document outlines the integration of various data sources and platforms, including products from NOAA, NASA, and other entities, to develop climate tools for Marine Protected Areas (MPAs). It highlights the importance of open access to data, guidance for downscaling methods, and the use of in situ, airborne, and satellite monitoring. The primary focus is on utilizing climatological data for assessing oceanographic conditions, enhancing education, and providing support for ecological forecasts and climate impact assessments. The framework aims to ensure effective integration and usability for diverse user groups.


Data Integration for MPA climate tools development
E N D
Presentation Transcript
Data Integration for MPA climate tools development Data Sources and Platforms -NWS/NBDC -NOS/CO-OPS -NESDIS -NASA C-Man, CO-OPS (NOS) -AVISO CNES -NMFS - OAR In Situ sensor, airborne, satellite monitoring, and modeled Shipboard Surveys and moored buoy monitoring Inputs Inventories, Databases, Climatologies, Data Input/ Format Requirements Freely Accessible and web-shared Reproducible, and Tractable for Rapid Assessment Compatible for Multiple Downscaling Methods Downscaling Requirements Guidance Driven Ingestible for diverse user groups Observations- Driven
Integrated Uses of Satellite Ocean Climate Data for MPAshttp://ccma.nos.noaa.gov/ecosystems/sanctuaries/olympic_nms.html Archival data records • Multi-Sourced image products • NOAA/NESDIS • NASA • AVISO • Remote Sensing Systems • GPCC • As end users of sustained operational ocean climate products, our interests were to • Develop and utilize an OCNMS satellite- derived ocean climate baseline for evaluating present oceanographic conditions and future trends. • Utilize baseline information to provide an educational forum for describing seasonal cycles, features, and processes through satellites. • Document a process for integrating satellite remote sensing into NOAA-supported MPA site characterizations and evaluations. Oceanographic/Hydrologic variables • Image/gridded products • Sea Surface Temperature • Fronts • Ocean color (chlorophyll and turbidity) • Sea Surface Height Anomalies • Currents • Winds • Precipitation/Discharge Climatological Summaries • Monthly median/mean/anomaly calculation • Quantile analysis • Time series analysis (Hovmöllers) • Non-parametric correlations • Edge detection
Data Integration for MPA climate tools development In Situ sensor, airborne and satellite monitoring Data Climatologies Shipboard Surveys, C-MAN, NOS, and moored buoy monitoring • Oceanographic • Sea Surface Temperature • Currents • Sea Surface Heights • Ocean color • Winds • Tides (water level) • Waves • pH • Salinity • Biologic and Health • Fish Surveys • Coral Reef • Benthos • Seagrass • Water Quality • Contaminants • Atmospheric and Climate • Air Temperature • Barometric Pressure • Winds • Photosynthetic Active Radiation • Clouds • Precipitation • ENSO • SO • AMO Explanatory Data Inputs and Variable Inter-relationships Light, Temperature, Clouds, Winds, Deposition Interannual & Decadal Oscillations Precipitation, Discharge, Runoff Atmospheric/Hydrologic and Climatic Conditions Sea Heights, Currents, Coastal Upwelling, Sea Temperature, Algal Productivity, Eddies and Fronts Transport, Tides and Sea Level, Winds, Internal Waves Oceanographic Conditions and Processes Large-scale Circulation Regime Shifts, Resiliency, Natural Community Structure and Function Ecosystem Status and Health Light Availability/ Turbidity, Nutrients, Dissolved Oxygen, Chlorophyll a, pH Species Diversity, Larval Retention and Dispersal, Migration patterns, Growth rates, Mortality rates Decreasing spatial and temporal scale
Data Integration for MPA climate tools development Explanatory Data Inputs and Variable Inter-relationships Light, Temperature, Clouds, Winds, Deposition Interannual & Decadal Oscillations Precipitation, Discharge, Runoff Atmospheric/Hydrologic and Climatic Conditions Sea Heights, Currents, Coastal Upwelling, Sea Temperature, Algal Productivity, Eddies and Fronts Transport, Tides and Sea Level, Winds, Internal Waves Oceanographic Conditions and Processes Large-scale Circulation Regime Shifts, Resiliency, Natural Community Structure and Function Ecosystem Status and Health Light Availability/ Turbidity, Nutrients, Dissolved Oxygen, Chlorophyll a, pH Species Diversity, Larval Retention and Dispersal, Migration patterns, Growth rates, Mortality rates Decreasing spatial and temporal scale Integrated Ecosystem and Observational Outputs Seasonal Cycles Baseline Atlas Climate Drivers Parameter Deviations Regional Patterns Governing Processes Field Evaluation Gap Analysis Heuristic Programming Expert Consensus Scenario Analyses Accuracy Assessment Decision Support and Education Tools Climate Impact Assessment Ecological forecasts Climate Observing Network
Data Integration for MPA climate tools development • Questions: • Given vast data sources, and platforms- What are the general data source requirements given project time frame? • Data sources should have no restrictions on access, usage, or dissemination • Originators data and derived data should be easily accessible, reproducible, and tractable • Data can be housed in separate offices, but web-sharing should be considered • Compatible for multiple downscaling methods • Given diverse data types- What are the general data guidelines to build a comprehensive site characterization of regional to local climate and impacts, given project time frame? • Spatial considerations (depends on downscaling method) • Temporal considerations (base intervals, temporal coverage) • Many tailored products and tools available- What are the general output requirements given project time frame? • Comparable to future • Ingestible for diverse end user groups • Timely for Rapid Assessment and Forecasting
NCCOS Interests • MPA site evaluations: • Climatological baselines of merged satellite information, in situ data, and derived model outputs should be a requirement for any MPA site characterization/evaluation: • Goal is to keep integrated approaches intact for the MPA climate agenda, through “descriptive downscaling”, and improved understanding of the linkages between climate drivers, ocean responses, and ecosystem shifts. • NCCOS can serve as one of the science links to ONMS for this project.
NOS/NCCOS Mission Statement in Climate and Marine Ecosystems- To provide local and national coastal managers with reliable climate tools for understanding human-climate interactions, and impacts on processes, species, and habitats. • Requires collaborative involvement with operational data centers, and coastal management offices, and a familiarity with operational product lines and services. • Requires the development of tailored products, including data climatologies and other interpretive tools. • Requires knowledge and expertise in multiple disciplines, working to integrate all data types of interest.
…more on Data sources • …more on OCNMS ocean climate methods and results
As end users of sustained climate products, interests were to Develop and utilize an OCNMS satellite- derived ocean climate baseline for evaluating present oceanographic conditions and future trends. Utilize baseline information to provide an educational forum for describing seasonal cycles, features, and processes through satellites. Document a process for integrating satellite remote sensing into NOAA-supported MPA site characterizations and evaluations. Characterization of Satellite Ocean Climate Data for the Olympic Coast National Marine Sanctuary- To provide critical marine elements for the OCNMS Management Plan Review. http://ccma.nos.noaa.gov/ecosystems/sanctuaries/olympic_nms.html
Data Synthesis Monthly climatologies SST SSHA Monotone Relationships Time series plots (Hovmoller Diagrams) Rho (Correlation) Maps
Results • Seasonal Patterns: • Downwelling peak • December/January • onshore mean flow • Elevated SSHA • lowest Chl/Highest • Turbidity • Upwelling peak • July/September • offshore mean flow • Decreased SSHA • highest Chlorophyll (September) • Lowest coastal SST versus off-shelf SST (September)
Key Technical Findings • Typical Conditions: • Sea Surface Temperature • Seasonal warming/cooling • Upwelling • Juan de Fuca Outflow and eddy circulation • Transport • Sea Surface Height Anomalies • Seasonal warming/cooling • Upwelling • Juan de Fuca Outflow and eddy circulation • Wind Effects • Currents • Transition periods • Ocean Color • Juan de Fuca outflow, eddy circulation and transport • Ekman-induced Pulses • Winter pulse? • Coastal precipitation vs. Columbia River plume • Winds • Transition periods • Coincident with mid-shelf chlorophyll drop in Fall
Ocean Climate Summary for OCNMS • Seasonal Cycles: • Winter Downwelling • Spring Transition • Spring/early Summer • Bloom period • Spring/early Summer • Bloom period • Spring/early Summer • Bloom period
Key Technical Findings Cont. SST Fronts and Chlorophyll Variability • Features: • SST frontal persistence estimates- • Edge Detection methods • Frontal characteristics (upwelling, eddy, shelf slope) • Increased convergence at surface? • Increased biological activity? • eddy circulation and movement • Chlorophyll variability estimates- • Quantiles (75th – 25th) • Co-located with SST fronts (at times) • Increased activity outside OCNMS? • Persistent vs. ephemeral chlorophyll enhancements (what’s more important?) Chorophyll and SST along front directions
Key Technical Findings Cont. SST vs. chlorophyll relationship May July • Variable Inter-relationships: • Rank Correlations (Spearman’s) • SST/Chlorophyll - • Negative relationship in Spring (May) • Positive relationship in Summer (July) • Hints at upwelling, enhanced vertical mixing in summer, and light/temperature • Turbidity (Rrs670)/Columbia R. • Discharge- • Negative relationship inside Sanctuary • Mid-shelf influence apparent • Turbidity (Rrs670)/Precipitation- • Positive relationship inside sanctuary • coastal precipitation is dominant influence on Turbidity signals Turbidity vs. Columbia R. discharge (left) and Precipitation (right) January January
Ocean Summary • Spatially and temporally resolved natural ocean zones: • highly dynamic and complex information • Highly analytical/semi-objective • How can we apply these natural ocean zones to OCNMS educational forums, monitoring strategies, or management plans January May Wind Wind Downwelling Upwelling Downwellng AND Coastal influence AND Columbia River Upwelling AND Juan de Fuca outflow/eddy Columbia River plume veers north because of Coriolis and wind. Columbia R. Plume September July Wind Wind Light AND Transport Transport Processes Light AND upwelling AND Juan de Fuca outflow/eddy Light AND upwelling AND Juan de Fuca outflow/eddy Light AND transport AND coastal/estuarine Light AND Upwelling AND coastal/estuarine Columbia River plume Columbia River plume
Ocean Summary • Effects of climate and variable response within sanctuary: • Warm ENSO has positive effect on SST, SSHA and negative effect on chlorophyll • Many other forcing factors involved (large-scale wave propagation, pressure gradients, density gradients) • Regional versus local scale forcing SST 1985 2006
Acknowledgements • OCNMS Project Team (Ed Bowlby, Nancy Wright, John Barimo, and others…thanks) and Remote sensing representatives from regional IOOS, NMFS, and Academia • NOAA Internal Review Team- CCMA (Tracy Gill, Matt Kendall, John Christensen, Rick Stumpf), NOS (Pam Rubin, Gini Kennedy), NESDIS/NODC (Ken Casey), NOAA/OCRM/ORR (Bill Lehr) • External Review Team- Cooperative Institute for Oceanographic Satellite Studies at OSU (Ted Strub, Maria Kavanaugh, Roberto Venegas), U. of Washington School of Oceanography (Barbara Hickey), U. of Maine School of Marine Sciences (Andrew Thomas)