Download
1 / 14
140 likes | 195 Views
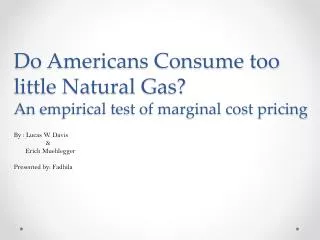
Lucas Davis, University of California Erich Muehlegger , Harvard University. Do Americans Consume Too Little Natural Gas? An Empirical Test of Marginal Cost Pricing. Presented by Yusuf Suryanto February, 2 2012. Scope.

E N D
Lucas Davis, University of California Erich Muehlegger, Harvard University Do Americans Consume Too Little Natural Gas? An Empirical Test of Marginal Cost Pricing Presented by Yusuf Suryanto February, 2 2012
Scope • This paper applies the standard natural monopoly framework to natural gas distribution in the United States. • Focusing on sales to residential, commercial and industrial customers. • This paper consists of the following : • Performing Empirical Tests • Discussing Possible Explanation of Empirical Results
Regulatory Background • Fixed Fee • Per Unit Price Natural Gas Operations 1 2 http://nicorgas.aglr.com/Business/PayYourBill 3 http://www.epa.gov/airquality/oilandgas/basic.html
Empirical Test1 - A Test of Marginal Cost Pricing • Estimated model • NRt = α0 + α1qt + et • NRt - monthly net revenue from customer class sales per customer • qt- monthly gas consumption per customer • α0 - the average amount paid in fixed fees • α1 - the average per unit markup over the city gate price • The hypothesis • H0 ; α1 = 0 (no markup over MC) • HA ; α1 ≠ 0 • Critical value/significant level • Reject the null if computed test statistic > critical value (small p-value). • 5% significant level--- (my assumption)
Results Test1 - A Test of Marginal Cost Pricing For all 50 states, all years and for all three customer classes p-value <.0001 :. They reject the null hypothesis (p-values less than 0.001). :. Markup over MC exists. :. Firms set higher per unit prices and lower fixed fee.
... Overall, the results imply an average markup across all customer classes of 36.4%
Empirical Test2 - (Price) elasticity of demand • Estimated model • Log(demand) = β0 + β1 log(price) + β1log(month-fixed-effect) + β2log(year-fixed-effect) + log(shifter) + e • The hypothesis • H0 ; β1 = 0 (demand is unit elastic) • HA ; β1 < 1 (demand is inelastic) • Critical value/significant level • Reject the null if computed test statistic > critical value (small p-value). • 10% significant level -- (my assumption) (my assumption)
Results Test2 • t statistic (3.35 ) > t critical (1.28) • t statistic (2.14 ) > t critical (1.28) • t statistic (2.39 ) > t critical (1.28) They reject the null hypothesis at 10% significant level
… Total DWL represents approximately 3% of the total market ($92billion in 2008).
Discussion of Possible Explanations • Profit Maximization • Incentives created by rate-return regulation • Typically s > r to increase Revenue increase B B depends on no. customers depends on barriers to entry (fixed fee) lower fixed fee. • Distributional Considerations • This structure is likely to have positive distributional consequences. • Low connection fees the existing rates imply that, within customer classes , high-demand customers pay a large share of fixed costs. • High-income households own large homes and consume high levels of natural gas, they will also pay a large share of total costs. • Environmental Externalities • As “tax” equal to the marginal damages from the emissions. • But the markups is less than 1% over average residential prices.
Ownership Structure • Energy Utilities
Remarks • First, this paper strongly rejects marginal cost pricing. This result holds individually and jointly for all 50 states and all customer classes. • Second, departures from marginal cost pricing are most severe for residential and commercial customers with markups averaging 45% and 42%. • Third, for conservative estimates of the price elasticity of demand, these distortions impose large aggregate welfare losses compared to marginal cost pricing. • In short, the current system with low fixed fees and high per unit prices implies that there are too many natural gas customers, each consuming too little natural gas.
TERIMA KASIH 谢谢你 СПАСИБО THANK YOU An equal opportunity/affirmative action university encouraging diversity.