Download

1 / 28
280 likes | 307 Views
Learn the importance of characterizing fragmentation in forestry, see examples of fragmentation analysis, and explore free software and available data for analyzing fragmentation.

E N D
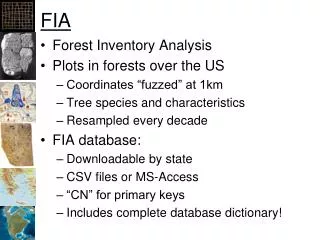
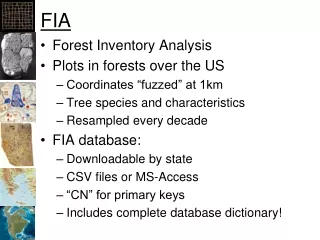
Techniques and Considerations for FIA Fragmentation Analysis Andrew Lister, Tonya Lister, Rachel Riemann and Mike Hoppus Northeastern Research Station, Newtown Square, PA alister@fs.fed.us
Goals of talk 1. Emphasize the importance of making it FIA’s business to characterize fragmentation 2. Show some examples of how fragmentation products might be of interest to analysts and customers 3. Illustrate exactly how it is that FIA units can analyze fragmentation using free or inexpensive software and readily- available data---easily!
Do the statistics on total or proportion of forest land tell the whole story? 61 % Forest 62 % Forest
Similarly, do the FIA statistical and analytical reports tell us what we want to know? Figure 1. Area by land class, Massachusetts, 1998 (Source: Table 1).
Unit 1985 1998 Percent change Western Massachusetts 1,317 1,348 + 2.3 Worcester 688 634 - 7.9 Eastern Massachusetts 1,219 1,144 - 6.1 State total 3,224 3,126 - 3.0 Do they help us analyze change in a sophisticated manner? Figure 2. Area (in thousand acres) of forest land and percent change, Massachusetts, 1985 and 1998 (Source: Table 48).
How could analysis be enhanced with a breakdown of landuse by county summarized from a continuous dataset, not a statistical estimate?
How are average forest patch size and area of forest related? What’s going on here? ALL FOREST CORE AREA
How are average forest patch perimeter and area of forest related?
What about analysis of the quality of forest edge in a county? E.g., Agriculture-Forest edge is very different from Urban-Forest edge.
Are volume of trees on forest land and edge density related?
Or are they related because edge density and average core area patch size are related?
Multi-colinearity is a problem in many fragmentation analyses. Before conducting the analysis, ask: What is the biological significance of a metric?
The point is, the inclusion of forest fragmentation reporting into the FIA framework will add a great deal of depth to our analytical capabilities.
Fragmentation Statistics 12 13
Worcester County Core Area Distribution 13
Methods for Calculating Fragmentation Statistics
1. 2. 3.
Pros and Cons: • Patch Analyst/Fragstats-Arcview • Pros: • very well documented • extensively tested • large user community • uses native GIS file formats (Arc-Info grids, coverages and shapefiles) • easy to use GUI • output is very nicely formatted • Cons: • will not work on very large areas (~20 x 20 km is a chore) • crashes unpredictably • consumes a lot of computer resources
Pros and Cons: • APACK • Pros: • well documented • growing user community • EXTREMELY efficient use of computer resources • can work on very large areas (easily 100 x 100 km, at least) • can run in batch mode (run multiple analyses at once) • produces most of Fragstats metrics, and some additional ones • output is versatile • Cons: • does not use native GIS format (but easy to convert) • output not quite as well-formatted as Patch Analyst
Pros and Cons: • Arc-Info – Arc-View • Pros: • “old standby” • relatively stable • can run very complex analyses over which you have control • uses GIS and other input formats • very large user community • well-documented • Cons: • relatively unstable – cryptic error messages (a.k.a. Dark Info) • consumes a lot of system resources (Arc-View) • no GUI (Arc-Info) • many analyses are too complex for intermediate programmers • not many shared landscape fragmentation routines
7 Steps for Calculating Fragmentation Metrics for Any State in North America • 1. Download free MRLC satellite image; format for Arc-Info • - 15 minutes 2. Convert to Erdas .gis format file - 2 minutes 3. Create simple batch file in Microsoft Excel -10 minutes 4. Type in one command at DOS prompt -2.7 seconds 5. Wait while APACK calculates statistics for each county -3-10 minutes 6. Concatenate output files -10 seconds 7. Format output -15 minutes
total time elapsed: 60 minutes and 12.7 seconds Sampling Error 3%
Conclusions Forest fragmentation statistics are extremely informative, and we should begin to produce them for at least each county in our areas. There is some danger, however, of implementing the lottery approach; we should always ask what is the biological significance of a metric before we conduct an analysis. The metrics are simple to calculate with free or readily-available raw data and software.
Thank You alister@fs.fed.us