
Population
E N D
Presentation Transcript
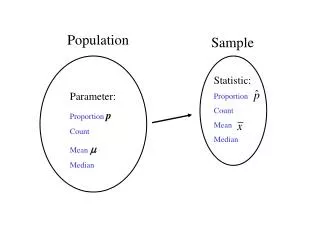
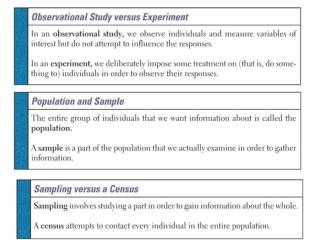
Population We are almost always interested in knowledge about a population. We would have little interest in samples if we could always ask everyone what they think about any particular issue – that is, we would conduct a census. The reality is that we can’t, so we need to get a sample that is representative of the population (I.e., shares characteristics of the population!)
Think about it… • If you were to take a blood test, wouldn’t you rather have a doctor take a random sample of your blood rather than take all of it?
Simple Random Sample All possible samples of a given size must be equally likely in order for the sample to be an SRS. Example: • Do we get an SRS from a class of 36 when we pick six names out of a hat? • Do we get an SRS if we only put rows 1-6 in a hat and pick out a row?
Examples 5.2, 5.3, and 5.4 are… • Example of bad sampling techniques! • Beware!
Technology Tip Example 5.5 demonstrates the use of the random number table to select an SRS of size 5 from a population of size 30. To do the same thing on your calcuator, select MATH PRB randInt(1,30) and press ENTER five times to get your sample. Ignore repeats. Or: randInt(1,30,5) (works fine as long as there are no repeats).
Sampling Designs • Stratified random sampling • Cluster Sampling • Multistage Sampling …all involve the use of chance to minimize bias in the sample. This doesn’t eliminate bias – it just controls for systematic bias.
Undercoverage vs. Nonresponse If I’m a prospective survey respondent, undercoverage occurs when the group I’m a part of is left out of the sample somehow., and nonresponse occurs when they can’t find me or I refuse to answer. In one case, my group isn’t in even in the sampling frame. In the other case, I don’t respond.
Sampling Techniques • Bad sampling techniques that do not produce good data: Convenience Sampling and Voluntary response sampling. • Good sampling techniques that do produce good data: Probability sampling; it is a sample chosen by chance. We must know what samples are possible and what probability each possible sample has.
Types of bias Never say “biased” – Name the bias! • Response Bias (respondents lie, behavior of respondent or of the interviewer influences results) • Wording of Questions • Undercoverage • Nonresponse
1. In late 1995, a Gallup survey reported that Americans approved sending troops to Bosnia by a 46 to 40 percent margin (46% said yes and 40% said no). The poll did not mention that 20,000 U.S. troops were committed to go. A CBS News poll mentioned the 20,000 figure and got the opposite outcome -- a 58 to 33 percent disapproval rate. Identify the bias(s).2. A church group interested in promoting volunteerism in a community chooses an SRS of 200 community addresses and sends members to visit these addresses during weekday working hours and inquire about the residents attitude toward volunteer work. Sixty percent of all respondents say that they would be willing to donate at least an hour a week to some volunteer organization. Bias is present in this sample design. Identify any and all types of bias involved and state whether you think the sample proportion obtained is higher or lower than the true population proportion. 3. A university’s financial aid office wants to know how much it can expect students to earn from summer employment. This information will be used to set the level of financial aid. The population contains 3478 students who have completed at least one year of study but have not yet graduate. A questionnaire will be sent to an SRS of 100 of these students, drawn from an alphabetized list. a) Describe how you will label the students in order to select the sample. b) Use Table B, beginning at line 105 to select the first 5 students in the sample.