Download
1 / 46
460 likes | 668 Views
Distributional and Poverty Impact Analysis within a General Equilibrium Framework. B. Essama-Nssah The World Bank DEC Course on Poverty and Inequality Analysis Module 7: Evaluating the Distributional and Poverty Impacts of Economy-Wide Policies April 28, 2009. Introduction. Impact Analysis

E N D
Distributional and Poverty Impact Analysis within a General Equilibrium Framework B. Essama-Nssah The World Bank DEC Course on Poverty and Inequality Analysis Module 7: Evaluating the Distributional and Poverty Impacts of Economy-Wide Policies April 28, 2009
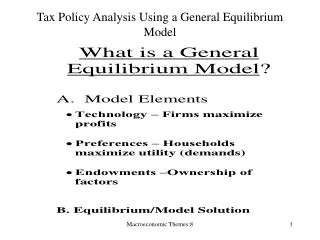
Introduction • Impact Analysis • An assessment of variations in individual and social welfare attributable to an exogenous shock or implementation of a policy. • Attribution based on a comparison of the policy state and the counterfactual, ceteris paribus.
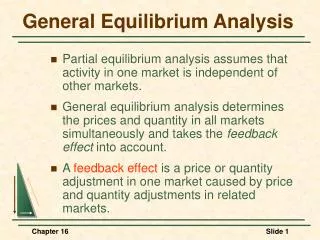
Introduction • Economy-Wide Shocks and Policies • Affect potentially the whole population • Are bound to have both macroeconomic, structural and distributional effects that work through a number of flow-of-fund variables and individual good or factor markets. • Need for an analytical framework that accounts for interdependence between stabilization, structural and distributional issues. • General equilibrium analysis offers such a framework.
Introduction • Approaches • Standard Representative Household (RH) • Impact on functional distribution of income, mean welfare within a few representative socioeconomic groups, and between-group inequality, but not on poverty. • Extended Representative Household • Extends the RH approach by modeling the size distribution within group, hence allowing poverty analysis in addition to what RH allows. • e.g. Lognormal (Dervis, de Melo and Robinson 1982) or Beta (Decaluwé, Savard and Thorbecke 2005) or Parameterized Lorenz (Essama-Nssah 2005)
Introduction • Approaches, continued • CGE-Micro-Simulation • Use unit record data from household survey to build a household model of expenditure, or income generation to allow a rich analysis of poverty and inequality. • Focus of Presentation • A Stylized ERH Framework • Positive component: a two-sector model of an open economy • Structure • Specification
Introduction • Stylized ERH, continued • Normative component: the Lorenz model of income distribution • Structure • Parameterization • Recovering Inequality and Poverty Measures • Numerical Implementation • Impact of Budgetary Policy • Policy Options • Outcomes
A Two-Sector Model of an Open Economy • Structure • A logical representation of a socioeconomic system wherein the behavior of all participants is compatible. • Organized around the standard Walrasian template.
Structure, continued • Two categories of agents: producers and consumers, or firms and households. • Supply and demand behavior: an observable consequence of the optimization assumption. • Market interaction: method of social coordination by mutual adjustment among participants based on “quid pro quo” (Lindblom 2001). • Behavioral compatibility entails equilibrium on all markets.
Structure, continued • Comparative statics entails comparison of equilibrium states associated with changes in the socioeconomic environment. • Social desirability depends on chosen criterion • Pareto efficiency focuses on how well the system promotes individual objectives: efficiency implies no other situation is unanimously preferred by all participants. • Poverty-focused criterion: less poverty is preferred to more.
Structure, continued • Incentives configuration such that amount of effective demand equals amount supplied. • Alternatively: • No feasible change in individual behavior is worthwhile. • No desirable change in individual behavior is feasible.
Circular Flow Chart for an Open Economy Factor markets Factor services Factor markets Producers Households Intermediate goods Product markets Final goods Exports Imports Rest of the world
Structure, continued • Social Accounting Matrix (SAM) • An accounting framework that reflects the circular flow of economic activity. • A square matrix: dimension based on the number of sectors and agents considered. • Each entry represents a payment to a row-account by a column-account. • Consistency implies that row total must equal corresponding column total. • Also, if all but one accounts balance, the last one must balance as well (Walras’ law).
Specification • Based on Devarajan, Lewis and Robinson (1990) • Two sectors of production: • Export good not sold domestically. • Home good used for both intermediate and final consumption • Imported and domestic intermediate goods enter the production process. • Production process in each sector represented by a Cobb-Douglas function
Specification, continued • The demand for labor is derived from first order conditions for profit maximization • Similarly for capital [capital is mobile in the long run]
Specification, continued • The net price in sector i is given by • a2i is the amount of aggregate intermediate good (Q2) per unit of output in sector i.
Specification, continued • Producer price of exports • Two aggregate commodities for final (j=1) and intermediate consumption (j=2)
Specification, continued • Import demand functions derived from cost minimization. • Demand for domestic components of aggregate goods (implication of cost minimization).
Specification, continued • Domestic price of imports inclusive of tariffs • Price of domestic sales includes a sales tax
Specification, continued • Producer price of the domestic good • Price of composite goods
Specification, continued • Rural household represents 60 percent of the population, and owns a fraction RL of labor and a fraction RK of capital (to be determined by data in SAM). • Urban household represents 40 percent of the population, and owns a fraction (1- RK ) of capital and a fraction (1- RL) of labor.
Specification, continued • Household income • Household demand for final good (no savings) • Government fiscal revenue
Specification, continued • Total demand for intermediate good • Equilibrium in the home good market • Material balance for composite goods
Specification, continued • Equilibrium condition for each factor market under full employment of given amounts of capital and labor.
Specification, continued • Government budget balance • Trade balance
The Lorenz Model of Income Distribution • Structure • A flexible statistical model of the distribution of some welfare indicator, x, among the population. • The Lorenz curve maps the cumulative proportion of the population (horizontal axis) against the cumulative share of welfare (vertical axis), where individuals have been ranked in ascending order of x.
Structure, continued • Alternative Expression based on : dp=f(x)dx • First-order derivative
Structure, continued • Second-order derivative • Parameterization • Based on General Quadratic (Datt 1992, 1998) • Lorenz
Quadratic model, continued • First Derivative • Second derivative
Recovering Inequality and Poverty Measures • From a parameterized Lorenz model and the mean of x, we can recover the following: • X: based on the mean and the first order derivative of the Lorenz function. • Density function of x, f(x): based on the mean and the second order derivative of the Lorenz function. • This is all we need to compute all inequality and poverty measures.
Numerical Implementation • Data • Base Year SAM
Data, continued • Calibrated Parameters
Data, continued • A is tfp (total factor productivity) parameter in the Cobb-Douglas production function • ’s are factor shares (exponents in the production function). • ’s are shares in the Armington aggregation function and B is a scale factor. • Distribution of factor income in base year SAM: RL=0.70, UL=0.30, RK=0.10, and UK=0.90 • Distribution of government transfers: RG=0.60 and UG=0.40
Data, continued • Distribution of foreign transfers: RF=0.20 and UF=0.80 • Base Year Income Distribution
Data, continued • Parameters underlying the General Quadratic Lorenz Model
Policy Options • Case 1: Reference • Tax on domestic sales: 15.4 percent • Tariff on imports of final and intermediate goods: 12.5 percent • Case 2: Reform Option A • Increase domestic sales tax by 5% (from reference) • Lower tariff on final import by 17.6% • Increase tariff on intermediate by 46.4 %
Policy Options, continued • Case 3: Reform Option B • Lower sales tax by 5% • Increase tariff on final goods by 18.4% • Lower tariff on intermediate by 44%
Outcomes, continued • Case 1: • Pattern of production and imports unchanged from the base case where there is no government intervention. • Optimal configuration of taxes to the extent that they do not distort private production decisions. • The redistributive policy associated transfers to households causes an increase in rural consumption and a decrease in urban consumption. • As a consequence overall poverty incidence decline by about 2.5 percent. • Rural poverty decreases by 5 percent while urban poverty increase by more than 6 percent.
Outcomes, continued • Case 2: • Production of exports increases, that of the domestic good declines. Both categories of imports increase. • Pattern of change in poverty incidence is similar to the reference case, but reduction in rural poverty and increase in rural poverty are a bit higher than in the reference case. • Case 3: • Production of exports and all imports fall while production of domestic good increases. • Change in poverty similar to previous cases.
Conclusion • Evaluating the social impact of economy-wide policies requires a social policy model framed within the logic of general equilibrium analysis. • Such a model has two basic components • A structural representation of individual behavior and social interaction based on the principles of optimization and quid pro quo. • A social evaluation function reflecting a chosen set of value judgments (e.g. efficiency and fairness). • A stylized analysis of the social impact of budgetary policy revealed the following: • The outcome hinges crucially on the underlying mechanisms allocating burdens and advantages among individuals. • Aggregate welfare effects may be negligible while structural and distributional impacts are significant. • the latter drive the political economy of policy-making.
References • Datt, Gaurav. 1998. Computational Tools for Poverty Measurement and Analysis. Washington D.C.: International Food Policy Research Institute (IFPRI) Discussion Paper No.50 (Food Consumption and Nutrition Division). • Datt, Gaurav. 1992. Computational Tools for Poverty Measurement and Analysis. Washington D.C.: The World Bank (mimeo) • De Melo Jaime and Robinson Sherman. 1989. Product Differentiation and the Treatment of Foreign Trade in Computable General Equilibrium Models of Small Economies. Journal of International Economics, Vol. 27:47-67. • Devarajan, Shantayanan, Jeffrey D. Lewis, and Sherman Robinson. 1990. Policy Lessons From Two-sector Models. Journal of Policy Modeling 12 (4): 625-657. • Dervis, Kemal, de Melo, Jaime, and Robinson, Sherman. 1982. General Equilkibrium Models for Development Policy. Washington, D.C.: the World Bank. • Decaluwé, B., Savard. L. and Thorbecke, E. 2005. General Equilibrium Approach for Poverty Analysis: With an Application to Cameroon. African Development Review, Vol. 17, No.2: 213-243.
Dinwiddy, C.L. and F.J. Teal. 1988. The Two-Sector General Equilibrium Model: A new Approach. Oxford: Philip Allan. • Essama-Nssah, B. 2006. Macroeconomic Shocks and Policies. In Aline Couduel and Stefano Paternostro (eds) Analyzing the Distributional Impact of Reforms. Washington, D.C.: The World Bank. • Essama-Nssah, B. 2005. Simulating the Poverty Impact of Macroeconomic Shocks and Policies. World Bank Research Working Paper No. 3788. Washington, D.C.: The World Bank. • Lindblom Charles E. 2001. The Market System: What Is It, How It Works and What to Make of It. New Haven: Yale University Press. • Varian Hal R. 1984. Microeconomic Analysis (Second Edition) New York: Norton & Company.