Download
1 / 20
200 likes | 216 Views
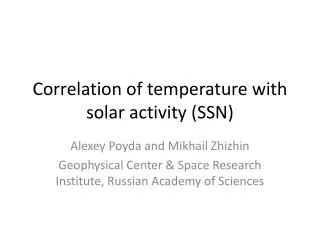
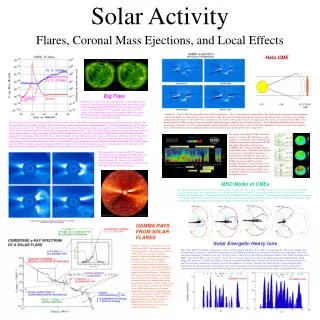
This study presents a multi-proxy reconstruction of solar activity over the last 9000 years, using long-span datasets of cosmogenic isotopes. The findings shed light on the variation of cosmic ray flux, solar magnetic activity, Earth's magnetic field, and climate. The study also explores the relationship between sunspot number and solar magnetic fields.

E N D
Nine Millennia of Solar Activity Leif Svalgaard Stanford University At HAO April 25th, 2019
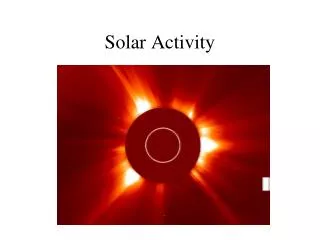
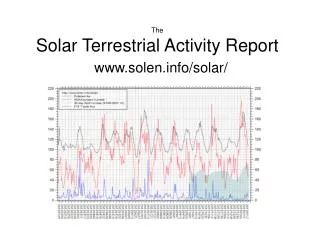
The Cosmogenic Record Wu et al. (Wu, C. J., Usoskin I. G., Krivova, N., et al. 2018, A&A, 615, A93) present a multi-proxy reconstruction of solar activity over the last 9000 years, using all available long-span datasets of the radioactive 10Be and 14C messengers in terrestrial archives. These cosmogenic isotopes are produced by cosmic rays in the Earth’s atmosphere and their measured production/depositional flux reflects changes in the cosmic ray flux in the past and depends on solar magnetic activity and on the variation of the Earth’s magnetic field and even on the climate (atmospheric circulation). The effect is expressed by the so-called modulation potential (cosmic ray energy spectrum).
Drilling for Ice Cores To measure the 10Be concentration and thus the Cosmic Rays thousands of years back in time Machine to count atoms of 10Be one by one Drill to depth of 3000 m Annual Layers in the Ice Greenland 10Be Record
Reconstructed Sunspot Number V1 The modulation potential is not very useful as a solar activity proxy since it is model dependent. So Wu et al. reconstructed the sunspot number (SN) instead (confidence interval shown by gray shading). The red line depicts the decadal average resampled SN (version 2, scaled down by 0.6 to make it version 1 because the reconstruction was based on the ‘Open Flux’ derived from version 1). The red line doesn’t quite fit: a bit (~20%) too high
A Systems Approach: Everything Must Fit Faraday wrote to R. Wolf on 27th August, 1852: “I am greatly obliged and delighted by your kindness in speaking to me of your most remarkable enquiry, regarding the relation existing between the condition of the Sun and the condition of the Earths magnetism. The discovery of periods and the observation of their accordance in different parts of the great system, of which we make a portion, seem to be one of the most promising methods of touching the great subject of terrestrial magnetism... Which we today can extend to solar (system) activity as well
The Dynamo Generating Solar Magnetic Fields • Systematic properties of sunspot groups indicate that they originate from a reservoir of organized East-West oriented (toroidal) field in the solar convection zone. • This field is generated by winding up a poloidal field (such as a dipole field aligned with the rotation axis) by the differential rotation of the Sun. • The poloidal field is (re) generated by the collective effect of loops formed from the toroidal field by convective flows and/or magnetic buoyancy. The loops become twisted owing to the Coriolis force and thus acquire a systematic meridional component. • This interplay of toroidal and poloidal magnetic field leads to a 22-year magnetic variation and an 11-year ‘cycle’ of sunspot activity (good review: Cameron and Schüssler, A&A, March 14, 2019; https://arxiv.org/pdf/1903.05398.pdf)
Sunspot Number and Group Number SNv2 Independent reconstructions of the revised sunspot record GN Almost no data Modern Wolf 13 Feb 1760 Full disclosure: there is still a rear-guard debate about this
Group Numbers can be Scaled to Sunspot Numbers Decadal Averages 1705-2015 There is simply proportionality [within their error bars] between the Sunspot Numbers and the Group Numbers allowing scaling of GN to SN (v2). Reminder: SN = 10 * GN + Number of spots [regardless of size]
Range [rY] of the daily variation of the Geomagnetic Field (Y comp.) George Graham 1722
Reconstructions of EUV and F10.7 R2 = 0.98 R2 = 0.96
rY: The Physics We can derive the EUV flux from the observed diurnal variation of the geomagnetic field Decadal averages scaled to SN v2:
Geomagnetic Storms Due to Much Enhanced ‘Ring Current’ The storms have a clear solar cycle dependence E. Sabine In 1852, Sabine recognized that the irregular magnetic variations correlated very closely with the number of sunspots Oppositely particles trapped in the Van Allen Belts drift in opposite directions giving rise to a net westward ‘Ring Current’. The Dst geomagnetic index [departure from quiet conditions] is a measure of the energy in the Ring Current Loss by collisions
Dst Index and the Nachstörung Since the daily variation is fairly regular from day to day we can eliminate it by considering the difference between consecutive days. The new IDV-Index is the difference from one day to the next without regard of the sign between the midnight values of the horizontal component H. The importance of this quantity was first recognized by the Scotsman Broun in 1861 SSC The IDV-index is a good proxy for the negative part of Dst
Applying the relationship we can reconstruct HMF magnetic field B with Confidence: And we can compute decadal averages and scale to SNv2:
Converting V1 to V2 Decadal Averages 1705-2015 Wu et al. claim that one can convert their version 1 reconstruction to version 2 by multiplying by 1/0.6 = 1.667. However, it seems that the better conversion factor is 20% larger, namely 2.00.
Putting it all Together Now everything fits as it should for the great system, of which we make a portion as Faraday realized so long go.
The Last Millennium Black: the corrected cosmogenic record. Red: the average multi-proxy record
The Full Composite Wu et al. Dataset (From 14C and 10Be) Nine millennia of reconstructed decadal sunspot numbers on the SILSO V2 scale. The WEA reconstruction is shown by the black curve with the stated uncertainty indicated by gray shading. The average Multimessenger reconstruction for 1615-2015 AD is shown by the red curve. The combined time series from 6755 BC to 2015 AD is available as an Excel file at https://leif.org/research/Nine-Millennia-SN.xls.
Periods and Cycles(?) in the Nine Millennia Solar Activity Record 10Be and 14C ‘Obs’ Wavelet Power Spectrum 88yr ~205yr Period (decades) ~350yr Non-stationary and intermittent ‘periodicities’ [if any]
Conclusions • We can construct a long-term record of solar activity by combining several proxies that all agree within their regions of overlap. This lends some credence to the notion that the records are reliable, especially the revised sunspot series. • It thus seems possible (likely?) that the 11-year Schwabe Cycle is the only real cycle; all the other (putative) ones due to intermittent stochastic variation of the properties of the cycle (Cameron & Schüssler). • Recent activity does not seem to be extraordinary (“largest in 10,000 years”)