Download
1 / 1
10 likes | 131 Views
Bikeways and Trails as Human-Ecological Corridors. John Martineau LAND 640 April 29, 2008. Sources Frank, Lawrence D., 2000, “Land Use and Transportation Interaction, Implications on Public Health and Quality of Life”, Journal of Planning Education and Research, Vol 20, pp. 6-22

E N D
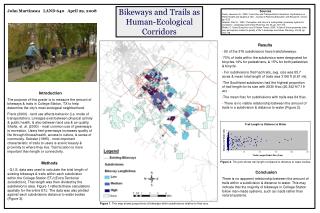
Bikeways and Trails as Human-Ecological Corridors John Martineau LAND 640 April 29, 2008 Sources Frank, Lawrence D., 2000, “Land Use and Transportation Interaction, Implications on Public Health and Quality of Life”, Journal of Planning Education and Research, Vol 20, pp. 6-22 Gobster, Paul H., 1995, “Perception and Use of a metropolitan greenway system for recreation”, Landscape and Urban Planning, Vol 33, pp. 401-413. Shafer, C. Scott, Bong Koo Lee & Shawn Turner, 2000, “A tale of three greenway trails: user perceptions related to quality of life” Landscape and Urban Planning, Vol 49, pp. 163-178. • Results • 80 of the 376 subdivisions have trails/bikeways. • 70% of trails within the subdivision were designated for bicycles,14% for pedestrians, & 15% for both pedestrian & bicycle. • For subdivisions that had trails, avg. size was 85.7 acres & mean total length of trails was 3198 ft (0.61 mi). • The Southland subdivision had the highest proportion of trail length for its size with 2830 ft/ac (20,342 ft/7.19 ac) . • The mean ft/ac for subdivisions with trails was 84 ft/ac. • - There is no visible relationship between the amount of trails in a subdivision & distance to water (Figure 2). Introduction The purpose of this poster is to measure the amount of bikeways & trails in College Station, TX to help determine the city’s most ecological neighborhood. Frank (2000) - land use affects behavior (i.e. mode of transportation). Linkages exist between physical activity & public health, & also between land use & air quality. Shafer, et. al. (2000) - most common use of greenways is recreation. Users feel greenways increases quality of life through fitness/health, access to nature, & sense of community. Gobster (1995) - most important characteristic of trails to users is scenic beauty & proximity to where they live. Trail location is more important than length or connectivity. Figure 2. This plot shows trail length compared to distance to water bodies. Methods - G.I.S. data was used to calculate the total length of existing bikeways & trails within each subdivision within the College Station ETJ (Extra Territorial Jurisdiction). That length was then divided by the subdivision’s area. Figure 1 reflects these calculations spatially for the entire ETJ. The data was also plotted against each subdivisions distance to water bodies (Figure 2). Conclusion There is no apparent relationship between the amount of trails within a subdivision & distance to water. This may indicate that the majority of bikeways in College Station follow man-made systems, such as roads rather than natural systems. Figure 1. This map shows proportions of bikeways within subdivisions relative to their size.