Download
1 / 21
210 likes | 370 Views
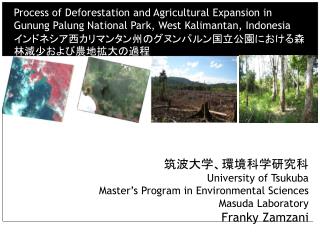
Process of Deforestation and Agricultural Expansion in Gunung Palung National Park, West Kalimantan, Indonesia インドネシア西カリマンタン州のグヌンパルン国立公園における森林減少および農地拡大の過程. 筑波大学、環境科学研究科 University of Tsukuba Master’s Program in Environmental Sciences Masuda Laboratory Franky Zamzani. Forest. g. Background.

E N D
Process of Deforestation and Agricultural Expansion in Gunung Palung National Park, West Kalimantan, Indonesia インドネシア西カリマンタン州のグヌンパルン国立公園における森林減少および農地拡大の過程 筑波大学、環境科学研究科 University of Tsukuba Master’s Program in Environmental Sciences Masuda Laboratory Franky Zamzani
Forest g Background Deforestation also occurred in national park Land-use changes Causes of deforestation : Proximate causes logging, agricultural expansion, infra-structure extension, etc. Underlying causes demographic, socio-economic, technology, policy, cultural factors (Geist and Lambin, 2002) Deforestation in Indonesia: 0.8 million ha/year (1993) 1.8 million ha/year (2000-2005) (Revilla, 1993; FAO, 2006) Non forest
Forest Cover Changes in Indonesia (1985-1997) Source: FWI/GFW, 2002
y Indonesia Objectives: To identify proximate and underlying causes of deforestation inside a national park Kalimantan Island Objectives and study area • Study site: • Gunung Palung National Park (GPNP) • West Kalimantan • Established in 1990 • 90.000 ha (in the document) Source: MoF, 2002
Gunung Palung National Park (GPNP) is one of 50 national parks in Indonesia located in West Kalimantan. Established in 1990. GPNP is the habitat of Orangutan (Pongo pygmaeus), Proboscis monkey (Nasalis larvatus), 236 birds species (Laman et al., 1996), and 73 mammals (Blundell, 1996). Comprises large variety of ecosystem, from coastal area to hilly mountain forest. The ecosystem has been threatened particularly after the economic crisis. Photo by: Tim Laman and GPNP Collection
Previous studies on GPNP Proximate causes of deforestation • Illegal logging • Agricultural expansion • Forest fires Underlying causes of deforestation • Legality of the boundary • No implementation of zoning • Lack of community supports • High dependency of local people on the resources inside the park (Soekmadi, 2002; European Union, 2005)
Methods • To examine land cover changes • To identify the driving forces of farmers that related to the agricultural expansion inside the national park Deforestation Land use changes Socio-economic characteristics • Spatial analysis (time series) • Landsat TM, ETM (1992, 1999) • SPOT5 (2004) Household survey: Type of land use Family size Education Monthly income Agricultural expansion • Land cover map • Identify the main • proximate cause Identify the underlying driving causes Discussion
Time series analysis remotely-sensed imagery Household survey Villages surrounding GPNP (17) Purposively selected, in the sense of encroachment Landsat 1992, 1999,SPOT5 2004 • Geometric • correction • Normalize/ • radiometric • Subset to • boundary Methods P Village S Village Sd Village T Village Landsat 1992, 1999,corrected S Village (397) Randomly selected Pre-processing Processing Without encroachment (237) With encroachment (160) Select training area • - Aerial Survey • Field-base • knowledge Respondents (41) Supervised Classification Randomly selected Forest cover map • Interviews • Key informants • Group discussion
y Study site Study site Location of household survey GPNP Source: MoF, 2002 Source: SPOT5 imagery, 2004
Forest Illegal logging area Grass/shrub Mix garden/bush Open land Settlement No Data g Land cover changes 1992 1999 2004
g Land cover changes Agricultural expansion
g 2004 Land cover changes 1999 1992 (X 1,000 ha) 100 Forest 80 20 60 40 Illegal logging area Mix garden/bush Open land Grass/shrub Settlement No Data
Forest Non Forest Deforestation in GPNP, 1992-2004 Deforestation • 1992-1999 = 0.6% per year • 1999-2004 = 2.0% per year
Deforestation in GPNP, 1992-2004 Rate of class change
Pattern of land cover changes, 1992-1999 g Forest 0 ha 0 ha 0 ha 1,430 ha 989 ha 675 ha Mix Garden/ Bush Grass/ Shrub 118 ha 205 ha 237 ha 259 ha 1,051 ha 139 ha Open Land
Pattern of land cover changes, 1999-2004 g Forest 0 ha 0 ha 0 ha 4,501 ha 1,235 ha 428 ha Mix Garden/ Bush Grass/ Shrub 1,191 ha 198 ha 255 ha 225 ha 213 ha 264 ha Open Land
rubber 1 14 10 14 dry-rice 2 0 0 Land-use type and allocation Socio-economic characteristic of encroachers wet-rice Source: Field survey, 2007 (August 3, 2007). Source: Field survey, 2007. n=41. • Land encroached: 83.8 ha • Average: 2.0 ha/HH
Socio-economic characteristic of encroachers Family size Source: Field survey, 2007. n=41 • Category: small (1-3 persons) = 13 HHs, middle (4-6) = 27 HHs large (>6)= 1 HH • Average family size = 4 persons/HH
Socio-economic characteristic of encroachers Labor forces in a household Source: Field survey, 2007. n=41 • Most of households opened new land by own labor. When a household had insufficient labor force to open larger area, “cooperative effort” (jejurukan) could be employed. This is a reciprocal exchange of labor force among households, which can be assumed as one of the reasons behind no correlation between labor force and the area of land encroached.
Socio-economic characteristic of encroachers Monthly income • 1 kg rice = Rp.3,500/kg (= 43 円/kg) • 1 kg rubber = Rp.6,000/kg (= 75 円/kg) • (1 円 = Rp.80) Source: Field survey, 2007. n=41 • Average income: Rp.1,252,700/month (=15,700円/month) • Rubber is 79% from the total source income • Dry-rice productivity: 400 kg/ha/year • Rubber:500 trees/ha, productivity: 6-8 kg/day on average
Illegal logging and agricultural expansion increased after economic crisis and decentralization which started in 1999. • Rubber gardens have been increased inside the park. The objective to plant rubber was to leave property to descendants. Their decision to plant rubber inside the park was related to the soil condition. • Zoning system of GPNP by clear demarcation (participatory mapping and communal agreement) is recommended. • Alternative income sources also should be created by the government for the farmers to diminish their dependencies to the NP. Discussions