
Master Google Analytics: Reports, Enhancements, Events | Improve Website Performance
E N D
Presentation Transcript
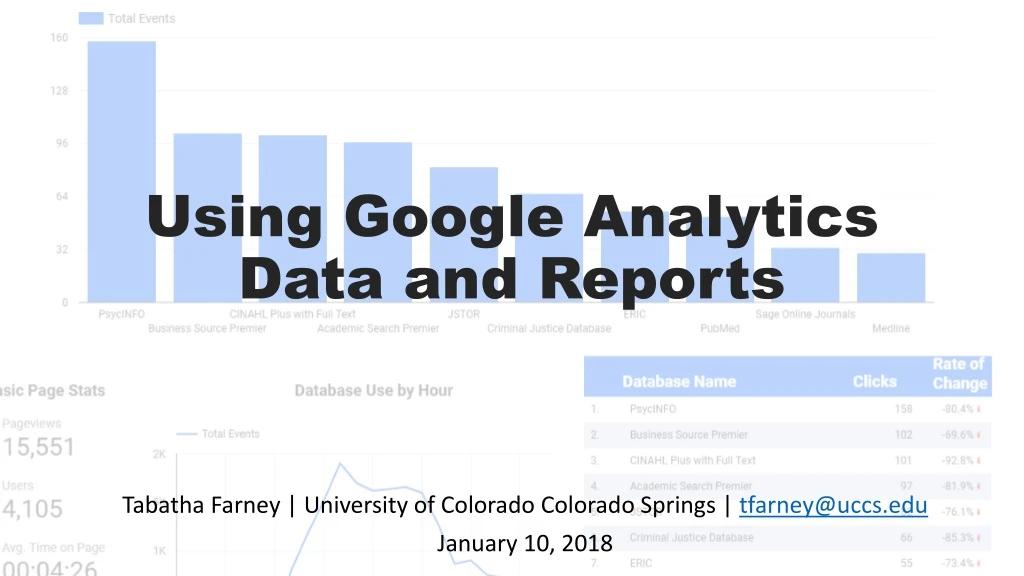
Using Google Analytics Data and Reports Tabatha Farney | University of Colorado Colorado Springs | tfarney@uccs.edu January 10, 2018
What is Google Analytics? Google Analytics is a digital analytics tool designed to collect and report use data related to an online presence. Digital Analytics Web Analytics
What can GA tell you? Nope! Yes! What* Why When Where Who*
Necessary Ingredients • Google account to create a GA account • Ability to add GA tracking code to the website code • But you should also consider: • Are you tracking more than one website? • Who needs access to the data? • What data is really meaningful to track on that website?
Account Organization Account Discovery Tools Property 1 Journal Portal Property 2 Link resolver and Article Linker View 3 (shared) View 1 View 2 (filters) View 1 View 2 (filters)
Basic Units of Measurement Session 1 Pageview 2 Pageview 1 Outbound link click User 1 Session 2 Session 3 Pageview 2 Pageview 1 Pageview 1 Closes browser Outbound link click Clicks back button User 2 * “How a session is defined in Analytics,” Analytics Help, https://support.google.com/analytics/answer/2731565?hl=en.
Testing a Webpage’s Performance • Some Data Observations: • 60% of pageviews were entrances to the site • About 670 pageviews were the last page the user viewed before exiting the site • 123 pageviews were from bounced sessions
Building Your Own Reports Custom dashboards and reports
Remove Bots Why do this? • Better data accuracy How to do this? • Admin feature • Found in the View settings Datadom, https://datadome.co/wp-content/uploads/2016/02/robocog-1.png
Enable Site Search* Why do this? • Search data tells you the information users want • Invaluable data about how users search a site (great for any search tool!) How to do this? • Admin feature • Found in the View settings • Need the Query Parameter for the search *Only works if you have your Google Analytics tracking code on it
Finding the Query Parameter http://library.uccs.edu/search/?searchtype=X&searcharg=harry+potter
Finding the Category Parameter http://library.uccs.edu/search/?searchtype=X&searcharg=harry+potter Category parameters are the search facets that can narrow search results.
Use Campaign URLs Why do this? • Improves acquisition data • Great for measuring how users find your website content (can even be used to measure offline referrals) How to do this? • Create a Campaign URL (Google’s Campaign URL Builder) for each place you’re posting that link • Use those Campaign URLs
Events What is it? event = user action Some examples: • Clicks on links • Form submissions • Video plays • File downloads • Pageviews longer than xx seconds • Clicks on anything!
Track Events Why do this? • Finally know what users are doing on your website • More accurate bounce rate How to do this? • Regular Google Analytics way • Google Tag Manager way
Regular Google Analytics Method Add the event tracking script to each event you want to track. _gaq.push([‘_trackEvent’, ‘Event Category’, ‘Event Action’, ‘Event Label’]);
<a href= “www.isiknowledge.com” onclick=“_gaq.push([ ‘_trackEvent’, ‘outbound link’, ‘click’, ‘social sciences citation index’]);”>Social Sciences Citation Index</a>
Time Saver Use
Configure Conversions What is a conversion? • A desired user action • Can be anything, but GA limits to time on site, pageviews per session, destination page, and event Why do this? • Helps measures website success • Makes you think about the purpose of your website
Events vs Conversions Should be limited to actions that directly link to your website’s purpose. Event is a metric to measure any user action you want to track. Conversion is a metric to measure the success of an action you want to track.
Configuring Conversions • Define your website goal and identify matching Google Analytics data point • In the Admin area, create the Google Analytics’ Goal. • Test your goal. • Save your goal.
When you intentionally track website use data, you are more likely to actually use that data to drive decisions. “Entre nos,” by Andres Hoyos, flickr.com.
Step 1. Identify the Purpose of the Website Why does that website exist? Advocate something Make users aware of something Teach something Find something Sell something
What is the purpose of the library catalog? Find something
Step 2. Select the data points to measure the website’s purpose. …and think outside the Google Analytics box
What information can determine if users found something in the library catalog?
Step 3. Is there anyone else that could use the data from the website? What do you my users really want but we don’t have? Wait, most failed searches are due to misuse of the subject search? Are people using the online government documents in the catalog? How can I improve catalog records for increased discoverability?
Step 4. Configure Google Analytics to track that data. Events!
Step 5. Report and share the data. • Keep reports relevant and focused • Make reports accessible • Choose a reporting mode that works • Follow up Sharing is caring.
Google Data Studio Example https://datastudio.google.com/open/0B00TmFXtGiT8UTQxYmFPUFZpdkE
Tableau Public Example https://public.tableau.com/profile/tabby.farney#!/vizhome/DiscoveryandSearchToolUsage/Dashboard1
Additional Resources • Farney, Tabatha. 2018. Using Digital Analytics for Smart Assessment. ALA Editions, Chicago. • Farney, Tabatha. 2016. “Google Analytics and Google Tag Manager.” Library Technology Reports. https://journals.ala.org/index.php/ltr/issue/view/613 • Google Analytics Academy, https://analyticsacademy.withgoogle.com/ • Google Analytics Help Center, https://support.google.com/analytics/?hl=en#topic=3544906 • Google Analytics Blog, http://analytics.blogspot.com/