Download
1 / 13
130 likes | 156 Views
Compare test scores using z-scores and percentiles in normal distributions. Determine who performed better and understand percentile calculations.

E N D
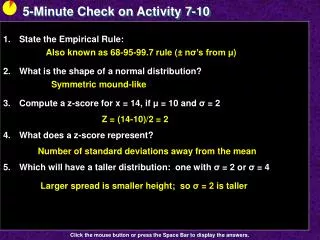
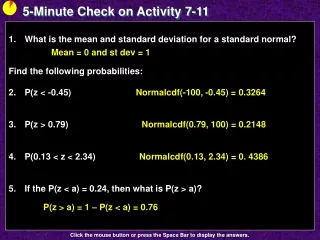
5-Minute Check on Activity 7-11 • What is the mean and standard deviation for a standard normal? • Find the following probabilities: • P(z < -0.45) • P(z > 0.79) • P(0.13 < z < 2.34) • If the P(z < a) = 0.24, then what is P(z > a)? Mean = 0 and st dev = 1 Normalcdf(-100, -0.45) = 0.3264 Normalcdf(0.79, 100) = 0.2148 Normalcdf(0.13, 2.34) = 0. 4386 P(z > a) = 1 – P(z < a) = 0.76 Click the mouse button or press the Space Bar to display the answers.
Activity 7 - 12 Who Did Better?
Objectives • Compare different x-values in normal distributions using z-scores. • Determine the percent of data between any two values of the normal distribution • Determine the percentile of a given x-value in a normal distribution • Compare different x-values using percentiles • Determine x-value given it percentile in a normal distribution
Vocabulary • Percentile – the percentage of data values to the left of a given value
Activity You and your friend are enrolled in two different sections of AFDA. Recently, different midterm tests were given in each section. Since the high school has large class sizes, the test scores in both sections are approximately normally distributed. In your section, the mean was 80 with a standard deviation of 6.7 and your score was 92. In your friend’s section the mean was 71 with a standard deviation of 6.1 and her score was 83. Is it possible to determine who did better? You claim you did. What bolsters your claim? What lessens your claim? Your score is higher than your friends The tests were different and your friend’s test may have been harder
Activity cont You and your friend are enrolled in two different sections of AFDA. Recently, different midterm tests were given in each section. Since the high school has large class sizes, the test scores in both sections are approximately normally distributed. In your section, the mean was 80 with a standard deviation of 6.7 and your score was 92. In your friend’s section the mean was 71 with a standard deviation of 6.1 and her score was 83. How far above the mean were you? How far above the mean was your friend? 12 points 12 points
Activity cont You and your friend are enrolled in two different sections of AFDA. Recently, different midterm tests were given in each section. Since the high school has large class sizes, the test scores in both sections are approximately normally distributed. In your section, the mean was 80 with a standard deviation of 6.7 and your score was 92. In your friend’s section the mean was 71 with a standard deviation of 6.1 and her score was 83. Compare your corresponding z-scores 92 – 80 12 Your z = ------------ = -------- = 1.79 6.7 6.7 83 – 71 12 Friends z = ------------ = -------- = 1.97 6.1 6.1
Percentiles One of the nice things about a normal distribution is that the cumulative probability (from the left), is the same as the percentile for the corresponding x-value. To get a percentile (or probability x < value) we can use our calculator: TI: normalcdf(-E99,score,mean,stdev) = percentile Our calculator even has a feature that allows use to find the x-value that corresponds to a particular percentile (or probability, x < x-value) TI: invNorm(pct,mean,stdev) = x-value
Activity cont You and your friend are enrolled in two different sections of AFDA. Recently, different midterm tests were given in each section. Since the high school has large class sizes, the test scores in both sections are approximately normally distributed. In your section, the mean was 80 with a standard deviation of 6.7 and your score was 92. In your friend’s section the mean was 71 with a standard deviation of 6.1 and her score was 83. What were your and your friend’s percentiles? Your % = normalcdf(-e99,92,80,6.7) = 96.34% Friends % = normalcdf(-e99,83,71,6.1) = 97.54%
Activity cont You and your friend are enrolled in two different sections of AFDA. Recently, different midterm tests were given in each section. Since the high school has large class sizes, the test scores in both sections are approximately normally distributed. In your section, the mean was 80 with a standard deviation of 6.7 and your score was 92. If your section was not curved, • What percentage got A’s? • What percentage got F’s? normalcdf(92.5, E99, 80, 6.7) = 0.0310 ≈ 3.10 % normalcdf(-E99,69.5, 80, 6.7) = 0.0585 ≈ 5.85 %
Example 1 In a national survey, it was determined that the number of hours high school students watch TV per year is was ~N(1500, 100). Determine the percentages of students that watch TV • less than 1600 hours per year • more than 1700 hours per year • between 1400 and 1650 hours per year normalcdf(-E99, 1600, 1500, 100) = 0.8413 ≈ 84.13% normalcdf(1700, E99, 1500, 100) = 0.0228 ≈ 2.28% normalcdf(1400, 1650, 1500, 100) = 0.7745 ≈ 77.45%
Example 2 Suppose Virginia Tech’s engineering program will only accept high school seniors with a math SAT score in the top 10% (above the 90th percentile). The SAT scores in math are ~N(500,100). What is the minimum SAT score in math for acceptance into the engineering program? invNorm(0.90, 500, 100) = 628.16 ≈ 629
Summary and Homework • Summary • Z-scores can be used to compare relative positions from two different distributions • Area under the normal curve is a graphical representation of both percentage and probability • Cumulative probability function is the area under the curve to the left of the given x-value • Use invNorm function on calculator to get the x-value corresponding to a given percentile • invNorm (percentile, , ) (percentile is a decimal) • Homework • pg 889 – 892; problems 1-3, 5-8