Download
1 / 25
250 likes | 268 Views
Learn about the different measures of central tendency in statistics, including the mean, median, mode, and midrange. Understand when to use each measure and how to calculate them. Discover the advantages and disadvantages of stem-and-leaf plots.

E N D
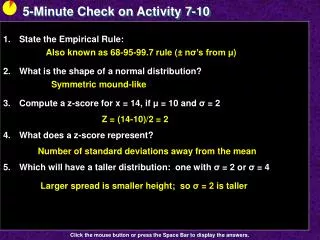
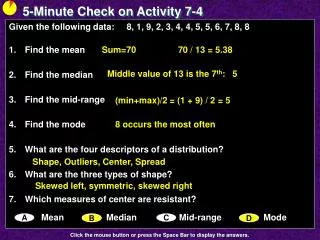
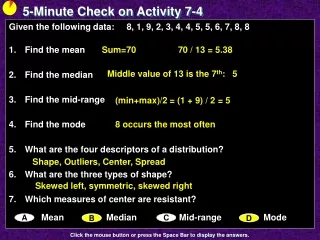
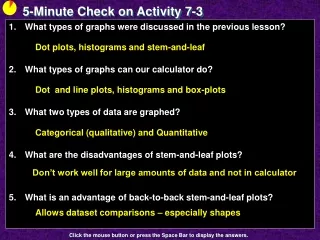
5-Minute Check on Activity 7-3 • What types of graphs were discussed in the previous lesson? • What types of graphs can our calculator do? • What two types of data are graphed? • What are the disadvantages of stem-and-leaf plots? • What is an advantage of back-to-back stem-and-leaf plots? Dot plots, histograms and stem-and-leaf Dot and line plots, histograms and box-plots Categorical (qualitative) and Quantitative Don’t work well for large amounts of data and not in calculator Allows dataset comparisons – especially shapes Click the mouse button or press the Space Bar to display the answers.
Activity 7 - 4 Class Survey Continued
Objectives • Determine measures of central tendency, including the mean, median, mode and midrange • Recognize symmetric and skewed frequency distributions • Distinguish between percentiles and quartiles
Vocabulary • Central Tendency – a statistic that measures the “center” of a distribution • Mean – the average value • Median – the middle value (in an ordered list) • Midrange – the average of the largest and smallest observations • Mode – the most frequent data value • Resistant measure – a measure (statistic or parameter) that is not sensitive to the influence of extreme observations
Activity In the previous activity the following data could have been representative of a class of 20 students. Family sizes: 4, 6, 2, 8, 3, 5, 6, 4, 7, 2, 5, 6, 4, 6, 9, 4, 7, 5, 6, 3 The frequency distribution of the data was displayed graphically using a dotplot and a histogram. Where does the center of the distribution appear to be? Between 5 and 6
Activity cont In the previous activity the following data could have been representative of a class of 20 students. Family sizes: 4, 6, 2, 8, 3, 5, 6, 4, 7, 2, 5, 6, 4, 6, 9, 4, 7, 5, 6, 3 What is the mean, median and mode of the distribution? Mean: average sum / 20 = 102 / 20 = 5.1 Median is the average of 10th and 11th ordered data: (5 + 5) / 2 = 5 Mode is the most frequent: 6 (occurs 5 times)
Measures of the “Center” • Common measures of a center of a distribution are: • Mean (the average of all the numbers) • Median (the middle value of all the numbers) • Mode (the most frequent occurring of the numbers) • Midrange (the average of the highest and lowest number in the distribution) • The first three are used a lot in statistical analysis
Mean • Mean: The “average” value of a dataset • What is the mean of the following numbers: 1, 2, 2, 5, 8, 9, 99 Add the numbers up: 1 + 2 + 2 + 5 + 8 + 9 + 99 = 126 Divide total by how many numbers: 126 / 7 = 18 Mean: (x-bar) x = 18
Median • Median: “middle” value of an ordered dataset • Arrange observations in order min to max • If odd number of data, locate the middle observation • If even number of data, average the two middle #’s • What is the median of the following numbers: 1, 2, 2, 5, 8, 9, 99 • What is the median of the following numbers: 1, 2, 2, 8, 9, 99 Numbers are already ordered from smallest to largest 5 is the middle value Numbers are already ordered from smallest to largest 2 and 8 are middle values, their average is 5
Mode • Mode: most frequent value of a dataset • Arrange observations in order min to max • Count how many times a value occurs • What is the mode of the following numbers: 1, 2, 2, 5, 8, 9, 99 • What is the mode of the following numbers: 1, 2, 2, 5, 8, 8, 99 Numbers are already ordered from smallest to largest 2 occurs the most often Numbers are already ordered from smallest to largest 2 and 8 are occur the most often bimodal (two modes)
Midrange • Midrange: average of largest and smallest • Arrange observations in order min to max • Add min and max, then divide by 2 • What is the midrange of the following numbers: 1, 2, 3, 5, 8, 9, 99 Numbers are already ordered from smallest to largest 1 + 99 = 100 then 100 / 2 = 50
Resistant Measures • A very small or large value of a distribution is an extreme value when it is greatly separated from the rest of the numbers • Extreme values will affect some measures of the center • Some are called outliers • Formally definition of outliers will come later • Measures that are not affected are called resistant • Median and mode are resistant • Mean and midrange are not
Which One Do We Use? • The mean and the median are the most common measures of center • If a distribution is perfectly symmetric, the mean and the median are the same • The meanis not resistant to outliers • Use the mean on symmetric data and the median on skewed data or data with outliers • The mode is a common measure of center for categorical data • You must decide which number is the most appropriate description of the center...
TI Calculator Help on “Center” • Press STATS, choose EDIT, and Edit again • Enter your numbers in L1(hit enter after each number) • Press STATS, choose CALC, and1: 1-Var Stats and hit enter and 2nd 1 (L1) and then enter again • A bunch of useful numerical calculations in determining center will be displayed: mean, min, median, and max
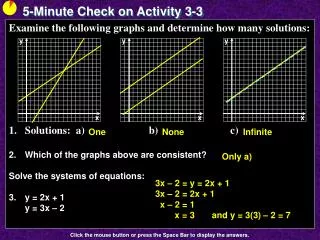
Distributions Parameters Median Mean Mode Mean < Median < Mode Skewed Left: (tail to the left) Mean substantially smaller than median(tail pulls mean toward it)
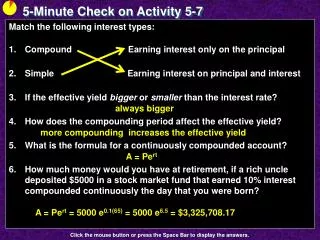
Distributions Parameters Mode Median Mean Mean ≈ Median ≈ Mode Symmetric: Mean roughly equal to median
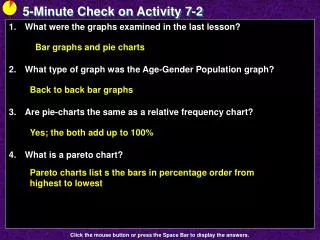
Distributions Parameters Median Mode Mean Mean > Median > Mode Skewed Right: (tail to the right) Mean substantially greater than median(tail pulls mean toward it)
Density Curves • Density Curves come in many different shapes; symmetric, skewed, uniform, etc • The area of a region of a density curve represents the % of observations that fall in that region • The median of a density curve cuts the area in half • The mean of a density curve is its “balance point”
Describing a Density Curve To describe a density curve focus on: • Shape • Skewed (right or left – direction toward the tail) • Symmetric (mound-shaped or uniform) • Unusual Characteristics • Bi-modal, outliers • Center • Mean (symmetric) or median (skewed) • Spread • Standard deviation, IQR, or range
Mean, Median, Mode • In the following graphs which letter represents the mean, the median and the mode? • Describe the distributions
Mean, Median, Mode • (a) A: mode, B: median, C: mean • Distribution is slightly skewed right • (b) A: mean, median and mode (B and C – nothing) • Distribution is symmetric (mound shaped) • (c) A: mean, B: median, C: mode • Distribution is very skewed left
Measures of Positions • Quartiles (available thru 1-VarStats) • Divide the data set into 4 equal parts • Q1: 25th percentile • Q2: 50th percentile (Median) • Q3: 75th percentile • Percentiles • Divide the data set into 100 equal parts
Statistics and Parameters • Parameters are of Populations • Population mean is μ • Population standard deviation is σ • Statistics are of Samples • Sample mean is called x-bar or x • Sample standard deviation is s
Summary and Homework • Summary • Frequency distribution describes the data’s shape • Listed in a frequency table • Visually depicted in dotplot, histogram or stem-leaf plot • Four typical measures of central tendency • Mean (aka average) • Median (middle value in ordered list) • Mode (most frequent data value) • Midrange (average of max and min) • Homework • pg 820–822; problems 3, 5, 7, 8