Download
1 / 26
260 likes | 326 Views
LC/ESI- MS Peptide Identification. Matthew Bellew mbellew@fhcrc.org http://edi.fhcrc.org/ STEDI software tools for the early detection initiative McIntosh Informatics Lab. LC/ESI-TOF MS in a nutshell. LC: Liquid chromatography:

E N D
LC/ESI-MS Peptide Identification Matthew Bellew mbellew@fhcrc.org http://edi.fhcrc.org/ STEDI software tools for the early detection initiative McIntosh Informatics Lab
LC/ESI-TOF MS in a nutshell • LC: Liquid chromatography: • A procedure for predictably delivering proteins over time to an MS system. • ESI (electro spray ionization): • Turns proteins in liquid into charged gas-phase ions. • TOF (time of flight) mass spec: • Charged detector at end of pipe. • Estimates mass to charge ratio (mz) of ions by their time of flight. • Estimates abundance by total ion current.
Basic approach to ESI-TOF Biomarker Discovery Two groups of samples; identify peptides/proteins that differentiate the groups. In spirit similar to SELDI/MADLI classification approach, but can facilitate its identification.
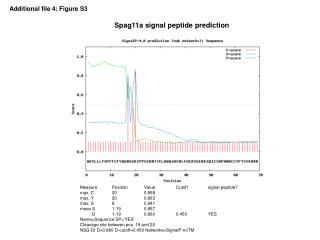
Isotopes in TOF-MS Mono-isotopic molecular weight: Always the first in the distribution Average MW
Quark’s Eye View peptide ? chemical noise ? mz time
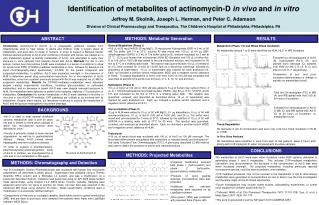
Basic Approach • For each scan Step 1 – Find Peaks (location,size) Step 2 – Extract Features • Find biggest peak • Find feature (peptide) that contains this peak • Repeat • Aggregate repeated features • Each peptide is scanned multiple times Feature 1 Feature 2 Feature 3
Find Peaks Goodness is one algorithm that performs well for many MS platforms
Find Peaks (size) Remove Background using sliding percentile filter • Increases contrast • Improves comparability of peaks in areas of different background levels • Report background level for filtering 240 100 180 50
Find peaks (location) • Peaks for highly charged ions overlap • Tim Randolph inspired approach • The signal we care about has specific characteristic width (1Da/maxcharge) • Wider or smoother changes are “background” • Narrower changes are “noise” • Compared to smooth/maxima approach, does not require fussy tuning
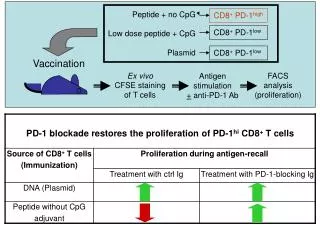
Extract Features • Evenly spaced peaks (1Da/charge) • We model peak intensities as Poisson distribution (µ=mass * 0.00049) • Distribution helps us determine first peak of a feature and untangle overlapping features • Kullback-Leibler measures between observed and expected signal 0.2Da spacing Nice Poisson shape Perfect 5+ peptide ?
Basic Approach Review • Analyze each scan Step 1 – Find Peaks (location,size) Step 2 – Extract Features • Find biggest peak • Find feature (peptide) that contains this peak • Repeat • Aggregate repeated features • The better the peaks, the better this works • Remove background • Wavelet analysis • Isotopic distribution
Aggregate Features • Features persist over multiple scans • This increases confidence in correct identifications • Doesn’t improve initial identification • Signal/noise can be low • Averaging/Smoothing across spectra helps (reduces high-frequency noise), but… • Leading/trailing edges of elution still look like noise
Complex sample… mz time
New Approach • Find peaks in 2D • mz and time: start, max, end • Persistence of individual peaks and of coincident peaks, raises confidence in identification • Allows very high sensitivity • Separate the peaks into groups • Extract features much as before
Algorithm • Find Peaks • Remove background (2D remove streaks as well) • Process scans with wavelet analysis (same) • Find all local maxima (in 2D, of course) • For each maxima, find where the peak starts and ends (above minimal threshold) • Throw out short features (endscan-startscan) • Throw out peaks not coincident with other peaks • Extract features from groups of related peaks
Complex sample… mz time
Find Peaks mz time
Extract Features mz time
Big peaks are boring • Interesting features are probably small • Identify small features with low false positive rate • Increase confidence in feature identification • Sensitive peak detection (wavelet) • Persistence of peaks • Coincidence of peaks (shape, location) • Isotopic distribution
Future Investigation • Local optimization of feature groups (avoid pitfalls of greedy extract feature algorithm) • Other scoring/quality functions • Global optimization (multiple charge states) • Alignment, should we be using peaks or features • confidence in peak existence can be higher than our confidence of feature charge/mass identification
Acknowledgements • Martin McIntosh – advisor • Tim Randolph – algorithm development • Mark Igra – alignment, viewer features • Pei Wang, Mark Coram, ChenWei Lin – quality analysis/validation • Dawn Kinsey – user, tester, analyst
Comparative Proteomics Profile complex serum/tissue samples with high resolution MS Extract “features” Compare cases/controls MS Data Online HPLC Sequentially scanned MS spectra Approx 1 scan/sec High resolution data >100 samples/Da Typical datasets 500Mb – 4Gb BDI
I1 I2 I0 I3 I4 Information we should be able to use when detecting features • Peptides have predictable isotopic distributional shape. • Peptides elute in predictable shape (most of the time).