Download
1 / 1
10 likes | 113 Views
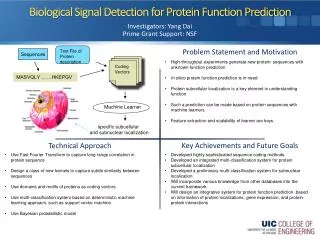
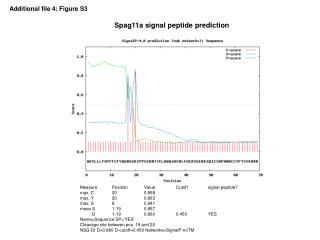
Analysis of signal peptide prediction for Spag11a using position value cut-offs, with emphasis on cleavage site between positions 19 and 20 using SignalP-noTM networks.

E N D
Additional file 4: Figure S3 Spag11a signal peptide prediction Measure Position Value Cutoff signal peptide? max. C 20 0.858 max. Y 20 0.863 max. S 8 0.941 mean S 1-19 0.857 D 1-19 0.860 0.450 YES Name=Sequence SP='YES' Cleavage site between pos. 19 and 20 NSG-DI D=0.860 D-cutoff=0.450 Networks=SignalP-noTM