Download
1 / 85
850 likes | 984 Views
This lecture by James Neill delves into the crucial elements of significance testing, including inferential decision-making, power, effect sizes, confidence intervals, and the impact of publication bias on scientific integrity. The discussion traces the historical development of significance testing, originated by Ronald Fisher for agricultural studies in the early 20th century, and critiques its widespread misuse in modern research. Recommendations are provided for transitioning to a more nuanced understanding of effect sizes and practical significance alongside traditional testing methods.

E N D
Survey Methods & Design in Psychology Lecture 11 (2007) Significance Testing, Power, Effect Sizes, Confidence Intervals, Publication Bias, & Scientific Integrity Lecturer: James Neill
Overview • Significance testing • Inferential decision making • Power • Effect Sizes • Confidence intervals • Publication Bias • Scientific Integrity
Readings Howell Statistical Methods: • Ch8 Power Concepts rely upon: • Ch3 The Normal Distribution • Ch4 Sampling Distributions and Hypothesis Testing • Ch7 Hypothesis Tests Applied to Means
Significance Testing • Logic • History • Criticisms • Hypotheses • Inferential decision making table • Type I & II errors • Power • Effect Size (ES) • Sample Size (N)
The Logic of Significance Testing In a betting game, how many straight heads would I need to throw until you cried foul?
The Logic of Significance Testing Sample Population
History of Significance Testing • A 20th C phenomenon. • Developed by Ronald Fisher for testing the variation in produce per acre for agriculture crop (1920’s-1930’s)
History of Significance Testing • To help determine what agricultural methods (IVs) yielded greater output (plant growth) (DVs) • Designs couldn’t be fully experimental, therefore, needn’t to determine whether variations in the DV were due to chance or the IV(s).
History of Significance Testing • Proposed H0 to reflect expected ES in the population • Then get p-value from data about the likelihood of H0 being true &, depending of level of false positives the researcher is prepared to tolerate (critical alpha), make decision about H0
History of Significance Testing • ST spread to other fields, including social science • Spread in use aided by the development of computers and training. • In the latter decades of the 20th C, widespread use of ST attracted critique for its over-use and mis-use.
Criticisms of Significance Testing • Critiqued as early as 1930 • Cohen (1980’s-1990’s) critiqued • During the late 1990’s a critical mass of awareness developed and there are currently changes underway in publication criteria and teaching with regard to over-reliance on ST
Criticisms of Significance Testing • Null hypothesis is rarely true
Criticisms of Significance Testing • NHT only provides a binary decision (yes or no) and indicates the direction • Mostly we are interested in the size of the effect – i.e., how much of an effect?
Criticisms of Significance Testing • Whether a result is significant is a function of: • ES • N • critical level • Sig. can be manipulated by tweaking any of the three (as each of them increase, so does the likelihood of a significant result)
Statistical vs Practical Significance • Statistical significance means that the observed mean differences are not likely due to sampling error • Can get statistical significance, even with very small population differences, if N is large enough • Practical significance looks at whether the difference is large enough to be of value in a practical sense • Is it an effect worth being concerned about – does it have any noticeable or worthwhile effects?
Significance Testing - Summary • Logic: Sample data examined to determine likelihood it represents a population of no effect or some effect. • History: Developed by Fisher for agricultural experiments in early 20th C • Spread aided by computers to social science • In recent decades, ST has been criticised for over-use and mis-application.
Recommendations • Learn traditional Fisherian logic methodology (inferential testing) • Learn alternative techniques (ESs and CIs) • -> Use ESs and CIs as alternatives or complements to STs.
Recommendations • APA 5th edition recommends reporting of ESs, power, etc. • Recognise merits and shortcomings of each approach • Look for practical significance
Hypotheses in Inferential Testing Null Hypothesis (H0): No differences Alternative Hypothesis (H1): Differences
Inferential Decisions When we test a hypothesis we draw a conclusion; either AcceptH0 p is not significant (i.e. not below the critical ) RejectH0: p is significant (i.e., below the critical )
Type I & II Errors When we accept or do not accept H0, we risk making one of two possible errors: Type I error: Reject H0 when it is actually correct Type II error: Retain H0 when it is actually false
Correct Decisions When we accept or do not accept H0, we are hoping to make one of two possible correct decisions: Correct rejection of H0 (Power): Reject H0 when there is a real difference Correct acceptance of H0: Retain H0 when there is no real difference
Significance Testing - Summary • Type I error (false rejection of H0) = • Type II error (false acceptance of H0) = • Power (false rejection of H0) = 1- • Correct acceptance of H0 = 1-
Power • The probability of rejection of a false null-hypothesis • Depends on the: • Critical alpha () • Sample size (N) • Effect size (Δ)
Power = Likelihood that an inferential test will return a sig. result when there is a real difference = Probability of correctly rejecting H0 = 1 - likelihood that an inferential test won’t return a sig. result when there is a real difference (1 - β) • Desirable power > .80 • Typical power ~ .60
Power An inferential test is more ‘powerful’ (i.e. more likely to get a significant result) when any of these 3 increase:
Power Analysis • If possible, calculate expected power beforehand, based on: • Estimated N, • Critical , • Expected or minimum ES(e.g., from related research) • Also report actual power in the results. • Ideally, power ~ .80 for detecting small effect sizes
Standard Case Sampling distribution if H0 were true Sampling distribution if HA were true alpha 0.05 POWER: 1 - T Non-centrality parameter
Increased effect size Sampling distribution if HA were true Sampling distribution if H0 were true alpha 0.05 POWER: 1 - ↑ T Non-centrality parameter
Impact of more conservative Sampling distribution if H0 were true Sampling distribution if HA were true alpha 0.01 POWER: 1 - ↓ T Non-centrality parameter
Impact of less conservative Sampling distribution if H0 were true Sampling distribution if HA were true alpha 0.10 POWER: 1 - ↑ T Non-centrality parameter
Increased sample size Sampling distribution if HA were true Sampling distribution if H0 were true alpha 0.05 POWER: 1 - ↑ T Non-centrality parameter
Power Summary • Power is the likelihood of detecting an effect as statistically significant • Power can be increased by: • N • critical • ES • Power over .8 “desirable” • Power of ~.6 is more typical • Can be calculated prospectively and retrospectively
Effect Sizes • ESs express the degree or strength of relationship or effect • Not influenced the N • ESs can be applied to any inferential test, e.g., • r for correlational effects • R for multiple correlation effects • d for difference between group means • eta-squared (h2) for multivariate differences between group means
Commonly Used Effect Sizes Standardised Mean difference • Cohen’s d • F / h2 Correlational • r, r2 • R, R2
Cohen’s d • A standardised measure of the difference between two Ms • d = M2 – M1 /
Cohen’s d • Cohen’s d -ve = negative change 0 = no change +ve = positive change
Effect sizes – Cohen’s d • Not readily available in SPSS • Cohen’s d is the standardized difference between two means
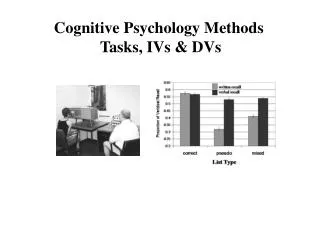
Example Effect Sizes Group 1 Group 2
Interpreting Standardised Mean Differences • Cohen (1977): .2 = small .5 = moderate .8 = large • Wolf (1986): .25 = educationally significant .50 = practically significant (therapeutic) • Standardised Mean ESs are proportional, e.g., .40 is twice as much change as .20
Interpreting Effect Size • No agreed standards for how to interpret an ES • Interpretation is ultimately subjective • Best approach is to compare with other studies