Download
1 / 7
70 likes | 143 Views
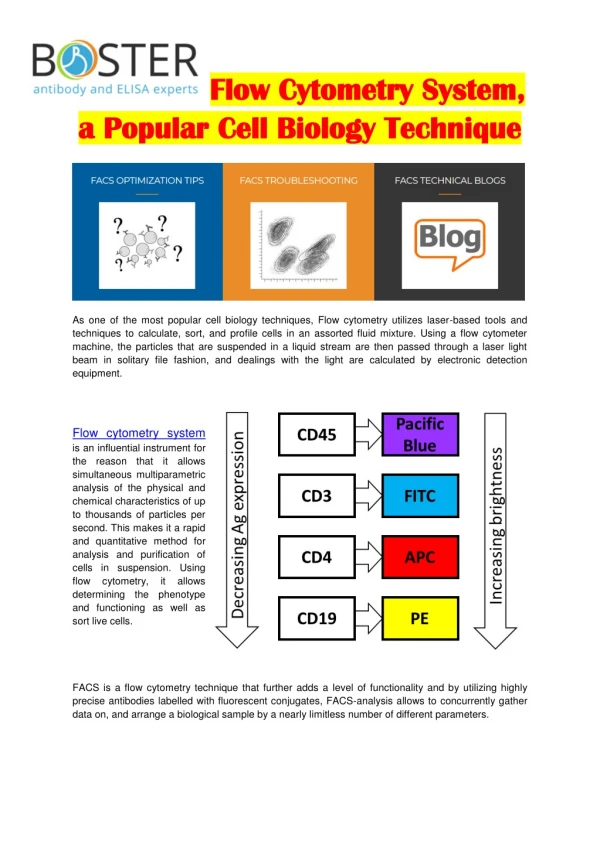
This research focused on analyzing genomic responses in trauma patients by investigating unique functional modules and cell-specific pathways. The study aimed to extract biological information through pathway analysis using data from various cell populations.

E N D
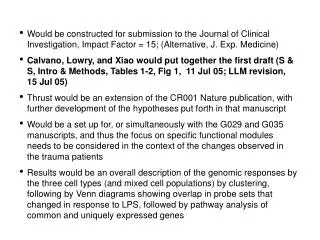
Would be constructed for submission to the Journal of Clinical Investigation, Impact Factor = 15; (Alternative, J. Exp. Medicine) • Calvano, Lowry, and Xiao would put together the first draft (S & S, Intro & Methods, Tables 1-2, Fig 1, 11 Jul 05; LLM revision, 15 Jul 05) • Thrust would be an extension of the CR001 Nature publication, with further development of the hypotheses put forth in that manuscript • Would be a set up for, or simultaneously with the G029 and G035 manuscripts, and thus the focus on specific functional modules needs to be considered in the context of the changes observed in the trauma patients • Results would be an overall description of the genomic responses by the three cell types (and mixed cell populations) by clustering, following by Venn diagrams showing overlap in probe sets that changed in response to LPS, followed by pathway analysis of common and uniquely expressed genes
The lack of complete 2 hr data, and the reduced enrichment of monocytes at 6 hrs would require that less emphasis be placed on the timing of changes, and more on the qualitative aspects of the changes • The dominant means of extracting biological information from the data set would be by pathway analysis, rather than by canonical analysis • Looking first at the subset of 132 genes whose expression changed concordantly, Wenzhong and Steve would look to see if there were common pathways that were affected in all three populations(Wen, gene list and pathways, 12 Aug 05) • A similar nonstatistical approach would be employed using the "Magic Cell". Dr. Moldawer would obtain from Wenzhong the gene lists, and would create "Magic PMNs", "Magic Monocytes" and "Magic Lymphocytes"(Wen, gene list, 10 Aug 05)
Wen should create from the overall interactome revealed in the CR001 Nature paper, individual interactomes based on the PMN, MO and T-cell data. The functional modules (9-10) identified in the CR001 paper should be re-explored using the cell specific gene expression data • Unique genes whose expression varied in specific cell populations would also be subjected to pathway analysis with the intent being to identifyi unique functional modules • For the T-cell specific pathways, Carol could provide unique insights into potential functional consequences for the changes in this cell population
Table 1. Differential cells counts over time to demonstrate the endotoxin-induced changes in lymphocytes, monocytes, and granulocytes Table 2. Leukocyte enrichment as assessed by flow cytometry. 1Data represent the Mean ±SEM; 2percent side scatter low, CD2 high; 3percent side scatter intermediate, CD33 high; 4quantity not sufficient for microarray analysis due to monocytopenia (see Table 1); 5percent side scatter high, CD66b high
Lysis Monocyte T cell 6h -2 2 6h -2 -2 2 6h Tcells Monocytes 1834 3064 171 Unique 1256 Unique 1750 152 255 991 Unique 4070 Neutrophils 5468 Neutrophil -2 2 6h Figure 1 CR003 Cell Specific Response Significant Genes (FDR < 0.01)
Common Genes of N/M/T cells at 6 hrs Number of probe sets at 1% FDR: 82 down, 50 up Number of probe sets at 5% FDR: 336 down, 144 up Number of probe sets at 10% FDR: 621 down, 260 up
Figure 2 HLA II CR003 MO CR003 lysis CR003 Neutrophil CR003 T