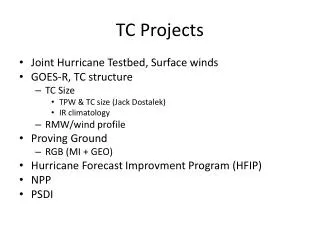
TC Forecasting
TC Forecasting. National Hurricane Center (NHC), Miami, FL. Outline. The Challenge Current Position and Intensity Track Forecasting Climatology and Persistence Numerical Models NHC Forecast Errors Improvements from Targeted Observations Intensity Forecasting SHIPS Models

TC Forecasting
E N D
Presentation Transcript
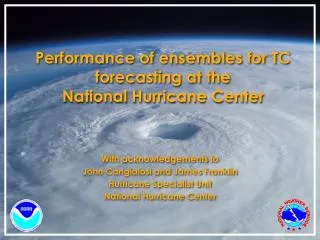
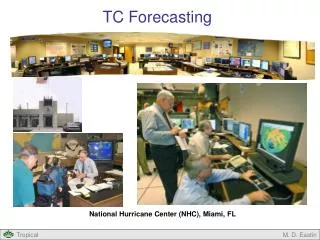
TC Forecasting National Hurricane Center (NHC), Miami, FL M. D. Eastin
Outline • The Challenge • Current Position and Intensity • Track Forecasting • Climatology and Persistence • Numerical Models • NHC Forecast Errors • Improvements from Targeted Observations • Intensity Forecasting • SHIPS • Models • NHC Forecast Errors • Seasonal Forecasting M. D. Eastin
TC Forecasting: The Challenge • Limitations • General lack of observations (most TCs are far from land) • Only the Atlantic Basin has routine aircraft penetrations • Rest of world relies on satellites and occasional ships and buoys • Limited observations are often inadequate for forecast needs • At times, discerning current intensity and location can be difficult • Some numerical models don’t even “know the TC exists” • and a “bogus” vortex must be inserted • Most models struggle forecasting evolution of the environment • Numerical models limited by resolution and processing speed • Most forecast models don’t resolve the eye or eyewall • 3-6 day forecasts of the region must be complete in a few hours • Incomplete understanding of meso- and convective-scale dynamics M. D. Eastin
TC Forecasting: The Challenge • NHC Responsibilities: • Two TC Basins • Atlantic and East Pacific • Each Tropical Cyclone • Current position and intensity • 12, 24, 36, 48, 72, 96, & 120 hr • forecasts of position, intensity, • and size • Public Forecast • Marine Forecast • Forecast Discussion • Issue watches and warnings • Coordination with local, state, • federal, and international groups • New forecasts are every 6 hrs NHC Forecast Process M. D. Eastin
TC Forecasting: The Challenge TPC/NHC Responsibilities Hurricane Watches: Hurricane conditions (winds > 65 knots) are possible in the specified area within 48 hours Hurricane Warnings: Hurricane conditions are expected in the specified area within 36 hours Analogous watches/warnings are initially issued for Tropical Storms (TS) Only NHC is authorized to issue tropical storm or hurricane watches and warnings Coordination with local and state governments often begins well before the watch is issued….Why? M. D. Eastin
TC Forecasting: Current Position & Intensity • Observational Sources (away from land) • Geostationary Operational Environmental Satellite (GOES) • Provides continuous 24/7 coverage • Visible and IR imagery • Dvorak Classification • Polar orbiting satellites (ASCAT/OSCAT, TRMM, SSMI, AMSU, MODIS) • Provide greater detail with more types of data • Snapshots of storm 1-4 times per day • Aircraft reconnaissance (Atlantic only) • Flight-level observations (multiple radial profiles across storm) • Dropwindsondes (vertical profiles at select locations – eye and eyewall) • Stepped Frequency Microwave Radiometer (SFMR) • (estimates of surface winds similar to ASCAT/OSCAT) • Ships • Surface observations on the periphery • Buoys • Few in number and most located near land M. D. Eastin
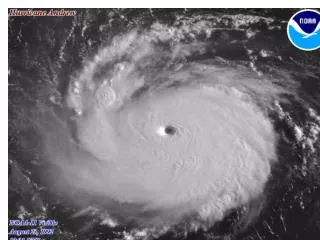
TC Forecasting: Current Position & Intensity Where’s the Center? • Location • Center of eye in satellite imagery • Center of circulation in animated • satellite imagery (when no eye) • Wind minimum from aircraft • Center of eye on aircraft radar • Intensity • Reduction of max flight-level wind • to the surface (~90% of FL max) • Dropwindsondes in the eyewall • SFMR (routinely available in 2007) • Dvorak Classification Scheme • Estimate intensity from cloud patterns in GOES VIS and IR imagery • Fairly accurate (errors of ~10 knots) • Very difficult to apply (only a few people are good) • Used globally (primary intensity estimate outside the Atlantic Basin) • Only intensity estimate for TCs in remote oceans GOES IR 85 GHz PCT M. D. Eastin
TC Forecasting: Current Position & Intensity What’s the Intensity? • Dvorak Classification Scheme • Takes advantage of two basic aspects: • TCs of similar intensity tend to have • similar cloud patterns • TCs develop in a slow predictable manner • Intensity is determined from an assessment • of the total cloud pattern, which is related to • a “T-number” and then to an intensity • Cloud patterns: • Curved Band (T1.0 – T4.5) • Shear Pattern (T1.5 – T3.5) • Central Dense Overcast (T2.5 – T5.0) • Banding Eye Pattern (T4.0 – T4.5) • Eye Pattern (T4.5 – T8.0) • The final T-number is arrived at by taking into account • the length and curvature of the banding as well as the • temperature difference between the eye and the • surrounding cold cloud tops of the eyewall GOES IR Atlantic Basin – Dvorak Table Max WindsMSLP T-number (knots)(mb) =============================== 1.0 - 1.5 25 - - - 2.0 30 1009 2.5 35 1005 3.0 45 1000 3.5 55 994 4.0 65 987 4.5 77 979 5.0 90 970 5.5 102 960 6.0 115 948 6.5 127 935 7.0 140 921 7.5 155 906 8.0 170 890 M. D. Eastin
TC Forecasting: Current Position & Intensity Dvorak Classification Scheme M. D. Eastin
TC Forecasting: Current Position & Intensity Dvorak Classification Scheme M. D. Eastin
TC Forecasting: Track • Track Forecast Models • CLIPER (CLImatology and PERsistence) • Statistical model • Based on the motion of all previous tracks of similar TCs in the same area • Predictors are storm location, motion, intensity, and Julian date • Benchmark for assessing other model’s track forecast skill • BAM (Beta Advection Model) • Simple Dynamical model • Uses vertically averaged steering flow from GFS model + Beta effect term • TC is initialized as a “point vortex” at a location with a motion vector • Three averaging layers: Deep (850-200 mb) • Medium (850-400 mb) • Shallow (850-700 mb) • LBAR (Limited area BARotropic) • Simple dynamical model – incorporates the Beta effect • Initialized using an idealized symmetric vortex and a storm motion vector • Uses vertically averaged steering flow and heights from the GFS model • Uses “nested grids” for greater detail of storm circulation M. D. Eastin
TC Forecasting: Track • Track Forecast Models • ECMWF (European Center for Medium-range Weather Forecasting) • Hydrostatic, global spectral model • Incorporates no “bogus vortex” • Includes the “4-D assimilation” of environmental observations • GFS (Global Forecasts System) • Hydrostatic, global spectral model (NCEP’s model) • Incorporates “vortex-relocation” based on initial model runs • Includes the “3-D assimilation” of environmental observations • UKMET (U.K. Meteorological Office) • Non-hydrostatic global spectral model • Incorporates a more complex “bogus vortex” based on synthetic data • Includes the “4-D assimilation” of environmental observations M. D. Eastin
TC Forecasting: Track • Track Forecast Models • HWRF (Hurricane Weather Research and Forecasting model) • Non-hydrostatic, limited-area, finite-difference model • Employs three “nested grids” (the inner two grid follow the TC) • Highest resolution is 3 km grid spacing • Incorporates a complex “bogus vortex” based on observations • Includes the “3-D assimilation” of environmental observations • Coupled to the ocean • GFDL (Geophysical Fluid Dynamics Laboratory) • Non-hydrostatic, limited-area, finite-difference model • Employs three “nested grids” (the inner two grids follow the TC) • Highest resolution is 5 km grid spacing • Incorporates a complex “bogus vortex” based on observations • Includes the “3-D assimilation” of environmental observations • Coupled to the ocean • Consensus “Models” (different models at the same forecast time) • TCOA (mean of GFDL, HWRF, UKMET, and GFS) • TVCA (mean of GFDL, HWRF, UKMET, GFS, and ECMWF) M. D. Eastin
TC Forecasting: Track Mean Absolute Error – 2013 – Atlantic M. D. Eastin
TC Forecasting: Track M. D. Eastin
TC Forecasting: Track M. D. Eastin
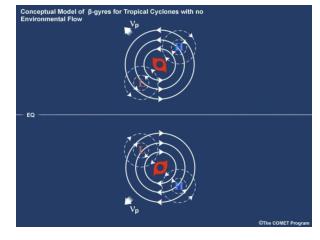
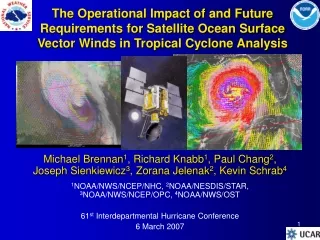
TC Forecasting: Track • Improving Track Forecasts with Targeted Observations: • Models initialized from a dense network of observations make better forecasts • Basic Idea: Identify regions of large uncertainty in the model forecasts of • steering flow, and go drop a network of sondes in the area Variance of the Deep Layer Mean Wind NOAA G-IV Aircraft Aircraft flight path and drop locations Areas of Large Uncertainty A deployed GPS dropsonde Forecast track of TS Bonnie 082198 M. D. Eastin
TC Forecasting: Track • Improving Track Forecasts with Targeted Observations: • Goal:Extra observations over data sparse regions will reduce model forecast • errors, which will lead to a reduction in official NHC forecast errors GFDL model track forecasts Forecast track All GPS Sondes Observed track Forecast Track No GPS sondes M. D. Eastin
TC Forecasting: Track Recent improvements largely due to impact of targeted observations and better model physics M. D. Eastin
TC Forecasting: Intensity • Intensity Forecast Models • SHIFOR (Statistical Hurricane Intensity FORecast) • Analogous to CLIPER • Based on intensity changes of all previous similar TCs in the same area • Predictors: current intensity, recent intensity trend, location, and Julian date • Benchmark for assessing other model’s intensity forecast skill • SHIPS (Statistical Hurricane Intensity Prediction Scheme) • Statistical / dynamical model • Uses a simple multiple regression on a variety of predictors** • Most skillful intensity forecast model • GFS model • HWRF model • GFDL model • Note: Intensity forecasts are often heavily based on forecaster experience • with (and recent trends in) convective patterns, vertical shear patterns, • moisture patterns, and the impact of deep warm ocean features. M. D. Eastin
TC Forecasting: Intensity Predictors for the Operational SHIPS Model M. D. Eastin
TC Forecasting: Intensity Small improvements largely due to a better SHIPS model, better bogus vortex, better data assimilation, and better numerical model physics related to convection M. D. Eastin
TC Forecasting: Track and Intensity • Track and Intensity Forecast Models • Additional information on these models and others, as well as details concerning each • model’s set-up, parameterizations, and run times can be found at: • http://www.nhc.noaa.gov/modelsummary.shtml • An in-depth presentation from NHC forecasters is also provided on the course website M. D. Eastin
TC Forecasting: Seasonal • Pioneered byDr. William Gray at Colorado State University • Uses winter and springtime “signals” to forecast upcoming • summer/fall Atlantic basin TC activity • Uses simple linear-regression techniques • Predictors:ENSO Feb-Mar • West African rainfall Previous Aug-Nov • West African east-west ΔT & ΔP Feb-May • Stratospheric QBO winds Apr-May • Caribbean SLP anomaly Apr-May • Caribbean 200mb U anomaly Apr-May Bill Gray M. D. Eastin
TC Forecasting: Seasonal • ENSO (El Nino - Southern Oscillation) • Based on SST anomalies in the eastern equatorial Pacific and the surface • pressure difference between Darwin and Tahiti in February and March • Warmer (Colder) waters produce more/stronger (less/weaker) convection • over the tropical Pacific • Increased (Decreased) outflow from the convection increases (decreases) • vertical shear over Atlantic basin • Warm waters (El Nino) = Less TC Activity • Cold Waters (La Nina) = More TC Activity M. D. Eastin
TC Forecasting: Seasonal • West African Rainfall • Based on rainfall totals in two regions (Western Sahel and Gulf of Guinea) • during the previous fall (August through November) • More (Less) rainfall acts to enhanced (suppressed) the following summer • monsoon through enhanced (suppressed) evaporation / evapotranspiration • A stronger monsoon will produce stronger convection and easterly waves, • increasing the likelihood of TC genesis • More Rainfall = More TC Activity • Less Rainfall = Less TC Activity M. D. Eastin
TC Forecasting: Seasonal • East-West Surface Temperature and Pressure Gradients in West Africa • Based on mean surface T and P differences between the western Sahel • and Gulf of Guinea regions in the spring (February – May) • A negative (positive) P-gradient and a positive (negative) T-gradient acts to • enhance (suppress) the onshore monsoonal flow that supplies the • easterly-wave convection with warm moist air • More/Stronger convection leads to increased likelihood of TC genesis • Negative P-gradient and a positive T-gradient = More TC Activity • Positive P-gradient and a negative T-gradient = Less TC Activity M. D. Eastin
TC Forecasting: Seasonal • Stratospheric QBO (Quasi-Biennial Oscillation) Winds • Zonal winds at ~50 mb reverse direction every 13 months (the QBO) • [More on the QBO later in the course] • Based on QBO wind direction over the equatorial Atlantic in April and May • Westerly (Easterly) QBO winds decrease (increase) the vertical shear near • the tropopause and thus help promote (inhibit) TC genesis • West-phase QBO = More TC Activity • East-phase QBO = Less TC Activity M. D. Eastin
TC Forecasting: Seasonal • Caribbean Sea-Level Pressure Anomaly • Based on island station sea-level pressures during April and May • Lower (Higher) pressures indicate a further poleward (equatorward) • excursion than normal of the ITCZ and/or a stronger (weaker) ITCZ • A strong-poleward (weak-equatorward) ITCZ brings enhanced (suppressed) • low-level convergence, convection and vorticity to the TC genesis region. • Low Pressure = More TC Activity • High Pressure = Less TC Activity M. D. Eastin
TC Forecasting: Seasonal • Caribbean 200-mb Zonal Wind Anomaly • Based on Caribbean island rawindsonde sites during April and May • Since the easterly low-level trade winds are nearly constant, stronger • (weaker) upper-level easterlies lead to increased (decreased) vertical • shear over the Atlantic’s primary TC genesis region • The predictor is slightly related to the phase of ENSO • Positive anomalies (weak easterlies) = More TC Activity • Negative anomalies (strong easterlies) = Less TC Activity M. D. Eastin
TC Forecasting: Seasonal CSU Atlantic Basin Forecast Verification Number of Hurricanes New Method (not discussed) Old Method (discussed in class) M. D. Eastin
TC Forecasting: Seasonal Other Seasonal Forecasts: Atlantic Basin: CSU (http://tropical.atmos.colostate.edu/forecasts/) NOAA (http://www.cpc.ncep.noaa.gov/products/outlooks/hurricane.shtml) Tropical Storm Risk (TSR) (http://www.tropicalstormrisk.com) Cuban Institute of Meteorology (CIM) (http://www.insmet.cu/ ) NC State (http://cfdl.meas.ncsu.edu/research/TCoutlook_2014.html) UKMET (http://www.metoffice.gov.uk/weather/tropicalcyclone/seasonal/northatlantic2014) West Pacific: Univ. Hong Kong (http://weather.cityu.edu.hk/tc_forecast/forecast.htm) TSR(http://www.tropicalstormrisk.com) Australia: TSR (http://www.tropicalstormrisk.com) Each forecast uses slightly different regional and global predictors Check out what each organization forecast for this year… M. D. Eastin
TC Forecasting: Seasonal • Purpose: • Benefits organizationsoperating • over large spatial scales with • diverse assets/responsibilities • (i.e., governments / companies) • Do NOT provide “point” forecasts • for the individual family M. D. Eastin
Tropical Cyclone Forecasting • Summary • Limitations • TPC / NHC Responsibilities • Observational Sources • Estimating Storm Location (methods) • Estimating Storm Intensity (methods) • Dvorak Classification Scheme (basic method) • Track Forecast Models (similarities / differences, performance) • Targeted Observations (goal, impact) • Intensity Forecast Models (similarities / differences, performance) • Seasonal Forecasts (predictors, physical linkages) M. D. Eastin
References Aberson, S. D., 2003: targeted observations to improve operational tropical cyclone track guidance. Mon. Wea. Rev., 131, 1613-1628. Aberson, S. D., and B. J. Etherton, 2006: Targeting and data assimilation studies using Hurricane Humberto (2001). J. Atmos. Sci.,62, 175-186. Blake, E. S., and W. M. Gray, 2004: Prediction of August Atlantic basin hurricane activity. Wea. Forecasting, 19, 1044-1060 DeMaria, M. and J. Kaplan, 1994: A statistical hurricane intensity prediction Scheme (SHIPS) for the Atlantic basin., Wea. Forecasting, 9, 209-220. DeMaria, M. and J. Kaplan, 1994: An updated statistical hurricane intensity prediction Scheme (SHIPS) for the Atlantic and eastern north Pacific basins., Wea. Forecasting, 14, 326-337. Demaria, M., M, Mainelli, L. K. Shay, J. A. Knaff, and J. Kaplan, 2005: Further improvements to the statistical hurricane intensity prediction scheme (SHIPS), Wea. Forecasting, 20, 531-543. Gray, W. M., C. W. Landsea, P. W. Mielke, and K. J. Berry, 1992: Predicting Atlantic seasonal hurricane activity 6-11 months in advance. Wea. Forecasting, 7, 440-455. Gray, W. M., C. W. Landsea, P. W. Mielke, and K. J. Berry, 1994: Predicting Atlantic basin seasonal tropical cyclone activity by 1 June. Wea. Forecasting, 9, 103-115. Klotzbach, P. J., and W. M. Gray, 2003: Forecasting September Atlantic basin tropical cyclone activity. Wea. Forecasting, 18, 1109-1128. Klotzbach, P. J., and W. M. Gray, 2004: Updated 6-11 month prediction of Atlantic basin seasonal hurricane activity., Wea. Forecasting, 19, 917-934. Velden, C. , and Coauthors, 2006: The Dvorak tropical cyclone intensity estimation technique. Bull. Amer. Met. Soc., 87, 1195-1210. M. D. Eastin