Download
1 / 25
250 likes | 380 Views
Stefano Orsini 1 , Valeria Mangano 1 , Alessandro Mura 1 , Francois Leblanc 2 , Anna Milillo 1 1 IFSI-INAF Roma, Italy 2 CNRS/IPSL Paris, France. Study of Sodium Intensity and Dynamics in The Exosphere of Mercury. Outline.

E N D
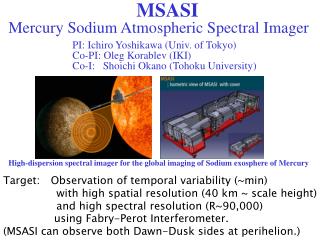
Stefano Orsini1, Valeria Mangano1, Alessandro Mura1, Francois Leblanc2, Anna Milillo1 1IFSI-INAF Roma, Italy 2CNRS/IPSL Paris, France Study of Sodium Intensity and Dynamics in The Exosphere of Mercury SERENA-HEWG meeting, Visby, Sweden, Aug 24-27, 2010, ORSINI et al.
Outline • It is well known that solar wind particles and photons, meteoritic impacts and interplanetary magnetic field have an influence on the morphology, content and time evolution of the Hermean exosphere. • By using a wide set of data taken during three years of Mercury sodium observation from the THEMIS solar telescope in the Canary Islands, we intend to analyze the variability of the Hermean exosphere sodium emission. • By referring to existing models, recently proposed, we try to interpret our images respect to the model expectations SERENA-HEWG meeting, Visby, Sweden, Aug 24-27, 2010, ORSINI et al.
Exosphere Upper part of the atmosphere where the column density is so low (less than 1014 cm-2) that the collision frequency between particles becomes negligible. Exobase is the boundary between collisional and not collisional regime (Earth case about 500 km altitude). In the case of absence of an atmosphere (Mercury case), we refer to surface-bounded exospheres. It is the result of a complex dynamic equilibrium with the surrounding systems, mainly: surface, magnetosphere and outer space. In this case the exobase is considered the surface itself. SERENA-HEWG meeting, Visby, Sweden, Aug 24-27, 2010, ORSINI et al.
THEMIS 0.90 m SolarTelescope SERENA-HEWG meeting, Visby, Sweden, Aug 24-27, 2010, ORSINI et al.
THEMIS 0.90 m SolarTelescope F/16 Ritchey-Chretientelescope in alt-azmounting Heliumfilledtelescope tube MTR mode formultilinespectropolarimetry Spectral range 400 to 1000 nm at : R ~ 220,000 Slit: 0.5" & 120 " long R ~ 400,000 Slit: 0.25" & 70 " long Four years of campaign (2007-2010) 96 days of observation Spectral resolution 0.027 Å to 0.016 Å Spectral dispersion 10.2 to 6 mÅ Four individual cameras, 2 for low and 2 for high resolution scanning of sodium D lines: D1 Na at 5896 Å D2 Na at 5889 Å THEMIS – Observatorio del Teide, Tenerife Latitude: N 28° 18' 12.42"Longitude: W 16° 30’ 32.04"Elevation: 2429 m SERENA-HEWG meeting, Visby, Sweden, Aug 24-27, 2010, ORSINI et al.
Raw data N SSP SEP E W SUN S Raw data are scansof a slit (0.5 x 120 low resolution or 0.25 x 70 high resolution) normalto the solarequator, in the E-W direction. The scansresult in a datacubeλx XxYgivingboth 2D spatialdimensions and wavelength. A text headerwithadditional information about the exposureisassociatedto the scan. Exosphericsodium D emission Disk of Mercury (reflected solar continuum) Spatial direction SolarFraunhoferD line Wavelenght SERENA-HEWG meeting, Visby, Sweden, Aug 24-27, 2010, ORSINI et al.
Calibrated 2D maps Sodium 2D maps, are the resultof the analysis (code byFrancoisLeblanc) of the raw data, that pass throughseveralsteps: Wavelenghtcalibration . Cleaningfromcosmicrays and instrumentalanysotropiesalong the CCD . Sky substraction . Na D identification and extraction (pixel by pixel, stepbystep). The resulting 2D maps are spatiallyexpressed in Rm (both x and y), and show the sodiumemissionsuperposedto the disk ofMercury. white cross is the SEP dashed zone is the not-illuminated side ofMercury dashedhorizontal curve is the subsolarmeridian Sunis at the bottom kR (kRayleigh) is the unitusedtomeasure the emissionintensity, and isdefinedasthe isotropic emission of 1010 photons from a sphere of 1 m2 radius. SERENA-HEWG meeting, Visby, Sweden, Aug 24-27, 2010, ORSINI et al.
Analyzed data samples/1 July 13, 2008 Same, interpolated SERENA-HEWG meeting, Visby, Sweden, Aug 24-27, 2010, ORSINI et al.
Analyzed data samples/2 April 28, 2008 November 7, 2008 April 22, 2009 June 30, 2009 October 22, 2009 SERENA-HEWG meeting, Visby, Sweden, Aug 24-27, 2010, ORSINI et al.
Sodiumvariability Na ground based observations reveal high to mid-latitude enhancements. Recently, Leblanc et al. 2008 registered intensity and width variation of the D1 and D2 spectral-line in time scale of 1 hour. K ground based observations reveal similar mid-latitude enhancements (Killen et al., 2007). (Leblanc et al., 2008) SERENA-HEWG meeting, Visby, Sweden, Aug 24-27, 2010, ORSINI et al.
Sodiumasymmetries dawn-dusk and low-high latitudes asymmetries (Schleicher et al., 2004) SERENA-HEWG meeting, Visby, Sweden, Aug 24-27, 2010, ORSINI et al.
Interplanetary dust & Na exosphere FromKamedaet al., BepiColombo SWT#6, 2009 Kameda et al., 2009 The distance from IPD symmetry plane is correlated with Na density. Similar tendency in Feb 2009. SERENA-HEWG meeting, Visby, Sweden, Aug 24-27, 2010, ORSINI et al.
・Short-term spatial variability? Concentration at high latitudes and small variability of average density still cannot be explained. FromKamedaet al., BepiColombo SWT#6, 2009 SERENA-HEWG meeting, Visby, Sweden, Aug 24-27, 2010, ORSINI et al.
North South Reconnection in the North Emisphere causes higher S/W proton precipitation fluxes (Fm Mura et al., 2006) Influence of IMF Negative Bx component of IMF causes reconnection in the North Emisphere (Sarantos et al., 2003, Kallio et al, 2003, Massetti et al., 2005) SERENA-HEWG meeting, Visby, Sweden, Aug 24-27, 2010, ORSINI et al. 14
(Fm Mura et al., 2008) Night Night Day North-South Asymmetry Simulated H+ flux Simulated precipitation flux using Montecarlo single-particle model, 106 test-particles/run SERENA-HEWG meeting, Visby, Sweden, Aug 24-27, 2010, ORSINI et al. 15
Ions Ions Ions TD PSD PSD From Mura et al. 2008 Sodium Variability Dawn Dusk Rotation TD SERENA-HEWG meeting, Visby, Sweden, Aug 24-27, 2010, ORSINI et al. BepiColombo SWT meeting, Blois
Sodiumdistribution SIMULATION OBSERVATIONS Is this complex process able to explain the short term variability? (Mura et al., 2008) SERENA-HEWG meeting, Visby, Sweden, Aug 24-27, 2010, ORSINI et al.
..by applying the Mura et al., 2008 model Impulsive ion precipitation event See the next simulation movie SERENA-HEWG meeting, Visby, Sweden, Aug 24-27, 2010, ORSINI et al.
SERENA-HEWG meeting, Visby, Sweden, Aug 24-27, 2010, ORSINI et al.
Data analysis Selectedperiods July 2008, 7 days; April 2009, 8 days; June 2009,6 days; October 2009,9 days. SERENA-HEWG meeting, Visby, Sweden, Aug 24-27, 2010, ORSINI et al.
Data analysis/2 We rotate the disk ofMercuryinto a newreference frame, withSubSolarpoint in the middle of the image, and weconsider the followingparameters: MeanIntensity= averagevalue (/pixel) of total emission North= sum of the emission (kR) comingfromall the region upper than 30 degreeslatitude South=sumof the emission (kR) comingfromall the regionlowerthan -30 degreeslatitude Equator= sum of the emission (kR) comingfromall the regionbetween +30 and -30 latitude High / Low Lat Asymmetry= (North + South)/Equator SERENA-HEWG meeting, Visby, Sweden, Aug 24-27, 2010, ORSINI et al.
Data analysis/3 Relevant intensity profile decrease, two evident peaks SERENA-HEWG meeting, Visby, Sweden, Aug 24-27, 2010, ORSINI et al.
Data analysis/4 Subsolarpoint in the middle of the image (Density columnintegral assumedasinvariant) 2008, July 13 2008, July 14 2008, July 15 2008, July 16 2008, July 17 2008, July 18 2008, July 19 Earth view (sun to the left) SERENA-HEWG meeting, Visby, Sweden, Aug 24-27, 2010, ORSINI et al.
Data analysis/5 The asymmetry and the Mean intensity show good correlation 2 3 1 4 7 Asimmetry profile verus time 6 5 SERENA-HEWG meeting, Visby, Sweden, Aug 24-27, 2010, ORSINI et al.
Conclusions Wehavecollectedseveralimagesof the exosphericNaintensity at Mercury, bymeansofgroundobservationsfrom the Themissolartelescope. Strong signalvariabilityhasbeenobserved Byselecting a specificperiod, when the meanintensitywasstronglydecreasing versus time, wehaveseenthatthisprofilecouldbe due to PSD emission, inducedby impulsive ionprecipitations at high latitudes, followedby a progressive decrease and diffusiontowardslowerlatitudes. Furtherstudiesforothersimilarcaseswillbeperformed in the next. SERENA-HEWG meeting, Visby, Sweden, Aug 24-27, 2010, ORSINI et al.