Download
1 / 24
240 likes | 384 Views
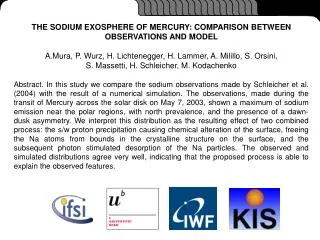
THE SODIUM EXOSPHERE OF MERCURY: COMPARISON BETWEEN OBSERVATIONS AND MODEL Mura, P. Wurz, H. Lichtenegger, H. Lammer, A. Milillo, S. Orsini, S. Massetti, H. Schleicher, M. Kodachenko

E N D
THE SODIUM EXOSPHERE OF MERCURY: COMPARISON BETWEEN OBSERVATIONS AND MODEL • Mura, P. Wurz, H. Lichtenegger, H. Lammer, A. Milillo, S. Orsini, • S. Massetti, H. Schleicher, M. Kodachenko • Abstract. In this study we compare the sodium observations made by Schleicher et al. (2004) with the result of a numerical simulation. The observations, made during the transit of Mercury across the solar disk on May 7, 2003, shown a maximum of sodium emission near the polar regions, with north prevalence, and the presence of a dawn-dusk asymmetry. We interpret this distribution as the resulting effect of two combined process: the s/w proton precipitation causing chemical alteration of the surface, freeing the Na atoms from bounds in the crystalline structure on the surface, and the subsequent photon stimulated desorption of the Na particles. The observed and simulated distributions agree very well, indicating that the proposed process is able to explain the observed features.
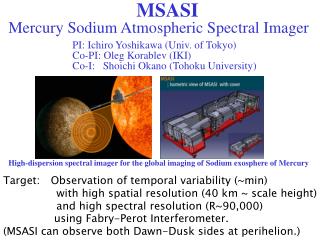
2 Observations Mangano et al., 2007 Potter et al., 2002 2
3 More observations… 3
4 Transit observations (1) From Schleicher, 2004 4
5 Observed Na column density. Data from Schleicher et al., (2004), obtained during the Mercury transit of May. 7, 2003. Y and Z axis are orientated according to the MSE frame i.e. Z is positive towards north; Y is positive towards dusk. Transit observations (2) 5
6 Measured by ACE, during May 7-9, 2003, distance from spacecraft to Earth, components of magnetic field, solar wind proton speed and density (http://www.srl.caltech.edu/ACE/ASC/level2/index.html). Transit observations (2) 6
North South Reconnection in the North Emisphere causes higher S/W proton precipitation fluxes 7 Influence of IMF Negative Bx component of IMF causes reconnection in the North Emisphere (Sarantos et al., 2003, Kallio et al, 2003, Massetti et al., 2005) 7
8 Simulated H+ flux Night Night Day North-South Asymmetry Simulated precipitation flux using Montecarlo single-particle model, 106 test-particles/run 8
9 Using only Ion sputtering… col dens. (cm-2) Y(RM) 1st Run: S/W precipitation causes Na ion sputtering Results: scale height too high, density too low (factor 100), no dawn dusk asymmetry 9
Other model Na S/W TD PSD • Production of sodium and water by proton sputtering of sodium- bearing silicates was considered by the following mechanism (Potter, 1995) 2H + Na2SiO3 → 2Na + SiO2 + H2O 1) Thermal desorption and PSD depleted Na contents 2) S/W causes chemical alteration of the surface, freeing the Na atoms from bounds in the crystalline structure on the surface Surface element Surface evolution model Sodium exospheric Montecarlo model Proton precipitation Montecarlo model 10
Ions Ions Ions TD PSD PSD 11 Dawn Dusk Sodium variability Rotation TD 11
12 • 24 x 48 elements surface grid, • time step = 10 m • total simulation time: 2 Mercury years • S/W flux: from numerical model • PSD flux: Some equations… • TD flux: 12
13 • The surface elements is “moved” and the following equation is solved numerically: …more equations. • and k takes into account the overall process yield and the probability that the proton found a Na atoms in the surface, considering the fraction of Na bearing minerals in the regolith (Wurz et al., 2008). • For the elements in the dayside: loss = k spu If we assume that particles released by TD always fall back onto the surface, this process does not contribute to the net flux from the surface; however, the Na atoms fall back within an area of radius <300 km. Thus, thermal desorption will also cause a smearing of the places of Na release on the day side. This effect has been simulated using 10000 test-particle for each time-step 13
14 Time evolution of Na: first hour TSC = N / loss 14
15 Time evolution of Na: a year 15
16 H+ and Na fluxes: comparison H+ flux onto the surface Na flux from the surface. The blurring is due to Thermal desorption 16
17 Finding optimal parameters • The simulation parameters can be tuned to better match the observed quantities. • Since the PSD flux is directly proportional to the H+ one, the main parameter is the energy distribution (controlled by the parameter U) • The energy distribution of the source controls also the scale height and the density of Na • Here we have chosen to use a value for U in order to match the wavelength dependence of the excess adsorption, which is related to the Doppler velocity shift along the line of sight 17
18 Finding optimal parameters From Schleicher et al. 2004 18
20 Results SIMULATION 2 106 test particle run OBSERVATIONS 20
21 • A critical hypothesis is to assume that the proton precipitation flux (on the night side) is constant over a very long time-scale (~ weeks): not realistic; • the time-scale for the equilibrium between H+ and PSD fluxes, on the dayside, is very short (~ one hour); • the north-south asymmetry is due to H+ precipitation on the dayside, which rapidly results in an enhancement of Na density in the high latitude regions; • the dawn-dusk asymmetry is caused by the planetary rotation and by the H+ precipitation on the night side; such a precipitation is predicted for most of the IMF conditions (for example, Kallio et al., 2003) Model limits 21
22 Results (2) From Kallio and Janhunen, GRL, 2003 From Delcourt et al, AG, 2003 22
23 Results (2) SIMULATION 105 test particle run OBSERVATIONS Including a uniform precipitation of 107 cm-2 s-1 on the night side (corresponding to a Na flux of 106 cm-2 s-1), we obtain a better fit of the dawn-dusk asymmetry. 23
24 • Neither PSD, nor IS alone are able to explain the observed features • There is a very good agreement between: • Column densities • Scale heights • Doppler widths • 3) Effect of other ion precipitation, and more refilling mechanism are going to be added • 4) A paper has be submitted to Icarus; poster to EGU: EGU2008-A-09131 Conclusions 24