Download
1 / 74
740 likes | 1.03k Views
Understanding Child Support Guidelines. Presentation to the Arizona Child Support Guideline Committee June 27, 2008. © 2008 Ira and Tara Ellman. Overview: Four Parts. What do our current guidelines really do? A look at the numbers they produce What should the guidelines do?

E N D
Understanding Child Support Guidelines Presentation to the Arizona Child Support Guideline Committee June 27, 2008 © 2008 Ira and Tara Ellman
Overview: Four Parts • What do our current guidelines really do? • A look at the numbers they produce • What should the guidelines do? • Some possible principles • What principles are favored by Arizona citizens? • How do they compare to current reality? • Why do the current guidelines do what they do? • Examining the theory of current guidelines, and • why it necessarily produces these results • What is the alternative? • How could we do them differently?
Part I: A look at current guidelines • The Classic Choice: Income Shares v. POOI • Wisconsin: Gross Income POOI State • Support equals flat percent of Dad’s Income • 17% for one child, • 25% for two, 29% for 3 • 34% for 5 or more • Mom’s income not considered • Income Shares: Mom’s income considered • But does it matter? Let’s find out.
POOI v. Income Shares • Assume Dad earns 1000, Mom earns 500 • Assume POOI and Income Shares states both set support at 17% for one child, as does Wisconsin • POOI: 17% of $1000 = $170 in support • Income Shares: longer route to same place • Total Parental Obligation = 17% of $1500 • 17% of $1500 = $255 • Dad pays 2/3 (1000/1500) of $255 • Which is $170
POOI v. Income Shares, continued • So why does the choice of POOI v. Incomes shares matter? • Answer: it’s the rate structure, not the fact that we look at both incomes • POOI: flatrats • Income Shares:decliningrates • Example: Arizona
Arizona Support Rates, 2005 Guidelines Rates start high, fall steeply Low and slowly falling above $8100 Plummet at $4200
One Effect of AZ’s Falling Rates • Dads with the same income pay different rates. • Mom’s rising income lowers Dad’s rate, not just his share of joint obligation. • Might seem fair to some, unfair to others. Compare Two Dads Who Both Earn $3000 1. Mom earns nothing: Dad pays 20% or $600 2. Mom earns $3000: Dad pays 14% or $420
Second Effect of AZ’s Falling Rates • Poor Mom realizes limited benefit from Dad’s rising income. • Dad’s rising income lowers his rate • Reduces the impact of his rising share of their joint obligation Compare Two Moms Who Both Earn $500 1. Dad earns 1000: pays 22% or $220 2. Dad earns 7000: pays 12% or $840 What is the impact of this result?
Gauging Impact of Support Amounts • How does the support amount affect each of the two households? • Gauging that is not easy. You must compare • Households of different composition • Which therefore need different amounts of money to achieve the same living standard. • But for lower income households, the official poverty threshold is one common measure • Simple to understand • Often used and therefore “standard”
Understanding Poverty Threshold • Developed in 1963 by Mollie Orshansky, a statistician in the Social Security Administration (formerly a Research Clerk with FDR’s Children’s Bureau • It’s basically the cost of minimal grocery market basket times 3. • “Updated” annually by Census Bureau for price of the market basket • Actual poverty judgments range from 125% to 180% of the “poverty threshold” • But “poverty threshold” still a standard benchmark
Some Monthly Income Benchmarks • Poverty level 2002 2007 • 2-adult, 1-child household: $1,207 $1,391 • “200 % Poverty” $ 2,414 $ 2,782 • Single person $ 780 $ 899 • Median income • for all US households: $3,550 • 80th Percentile income • For all US households: $7,001 • 95th percentile income • for all US households: $12,500
CHART 3 INTRO MIDDLE INCOME Intact family was at 300% of poverty level Situation: Middle Income Household with One Child Outcomes AFTER payments Possible outcomes for Mom and Child BEFORE payments. Mom’s Income Share
CHART 5 LOW INCOME MOM Payment helps, but not nearly enough to restore old living standard. After $468 payment, Mom and Child at 150% of poverty Mom earns 30% of combined income, or $1065, near poverty level. Situation: Low income Mom from a middle-income intact household.
Three Moms with 1 Child Each Earns $1000 Low Income Dad High Income Dad Why Doesn’t Higher Income Dad Help More? Answer: Rates Fall as Dad’s Income Rises
HCART 4 TWO CHILDREN How two middle- class children can have very different outcomes: Falls near poverty with low earning Mom. Keeps middle class life style with high earning Mom . Conclusion: Where noncustodial parent earns the majority of income, our guidelines do not protect children from large declines in living standard when their parents separate.
Overview: Four Parts • What do our current guidelines really do? • A look at the numbers they produce • What should current guidelines do • Some possible principles • What principles are favored by Arizona citizens • How do they compare to current reality? • Why do the current guidelines do what they do? • Examining the theory of current guidelines, and • Why it necessarily produces these results • What is the alternative? • What is the alternative? • How could we do them differently?
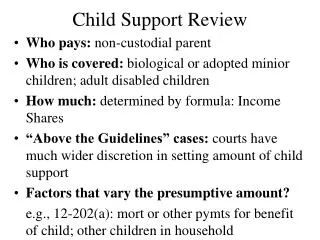
Goals of Support Guidelines • Protect Child Well-Being • Especially important for low-income CP’s • Recognize Dual Parental Support Obligation • Explains why we require support even when CP has adequate income for child • Avoid Gross Disparities in Living Standard • Explains why we go beyond basics • Balance above against Earner’s Priority Principle
1. Measurable Child Well-Being The solid or the dashed line?
Well-Being, continued Empirical literature suggests the solid line--but • Value judgments cannot be avoided • ` What counts as well-being? • Long v. Short term? • How to measure and aggregate?
Well-Being, continued Possible Working Assumptions • Curve steep to Point A, the “minimum decent living standard”—perhaps 150% of poverty threshold • Curve begins to flatten at Point B • Perhaps 60th to 80th Percentile of household income • As well-being returns decline, so does the child well being rationale for any support claim on obligor.
Possible Well-Being Principle • First Purpose of Child Support is to Ensure Child Well-Being • The lower is the custodial household income, • the more well-being a support dollar buys • And therefore the stronger is justification for requiring support from the obligor • Summary: The lower the CP income, the more we should ask of the obligor
Dual Obligation Principle • Explains why we require support even when • CP has more money than NCP • CP has lots of money • Multiple reasons for Dual Obligation • Moral claims • Fairness to CP • Maintain obligor’s authenticity as parent • Dual Obligation says little about how much • Fair share of the well-being amount • Nominal may be enough when WB not at issue
Gross Disparity Principle • Fairness claim for child, not Well-Being claim • Shield innocent victim of break-up from disproportionate living standard loss • Fairness argument more powerful if child • Had enjoyed higher standard for some time • Sees Obligor’s new family enjoying high standard • Problem: Windfall benefit to CP • Compromise: Avoid “Gross” Disparity
Gross Disparity, continued Two Possible Gross Disparity Principles • Version One: where family was intact • Child’s living standard should not decline too much more than Dad’s • Version Two: where there was no long-term intact family • Child’s living standard should not be grossly inferior to Dad’s • When Relevant? When there is • A high-income obligor, and • We are at flatter end of the Well-Being curve
Earner’s Priority Principle • Everyone keeps what they have unless there’s a very good reason to take it from them. • Especially the poor. • For poor obligors: Self-support reserve trumps even child well-being • For higher income obligors • Gross Disparity a less powerful counterweight to EPP than child well-being: • Hence we allow some disparity • Validates objection to “hidden alimony” • But Child Well-Being is “a very good reason”
EPP continued Possible EPP Principles • For low-income obligor: • Award only nominal amounts from impoverished obligors • Never reduce obligor income below poverty levels. • For higher income obligor • The award should preserve a living standard advantage over CP household, if child well-being not at risk: • child has a “decent minimum” or • Something more than decent minimum
Overview: Four Parts • What do our current guidelines really do? • A look at the numbers they produce • What should current guidelines do • Some possible principles • What principles are favored by Arizona citizens • How do they compare to current reality? • Why do the current guidelines do what they do? • Examining the theory of current guidelines, and • Why it necessarily produces these results • What is the alternative? • How could we do them differently?
What Do Arizona Citizens Believe? How Do You Ask? • Attitudes or support amounts? • We asked about both • Their relationship provides insights • But ultimately, amounts matter most • Do not anchor • If you want to know what people think, do not first tell them what others think
Who We Asked • Members of Pima County jury pool • 65% to 70% response rate to long forms • This data based on N of 407, of whom: • 55% were women • 62% were married, 35% were divorced • 69% had children • 12% had paid support, 18% had received it • 97% graduated high school, 25% had B.A. • 5.6% earned less than $15,000 • 46% earned more than $60,000
Of the 30% who have been in the child support system, nearly all the Obligors were men, and nearly all the Custodial Parents were women
What We Ask: Support Amounts • One child (9 year old boy) • Mom is CP, Dad is support obligor • Son “lives mostly with Mom, but Dad sees him often” • Dad earns $6000, $4000, or $2000 a month in “take-home pay”. • Mom: $5,000, $3,000, or $1,000 • Everyone asked about all nine income combinations • Rs either Name or Choose a support amount
The Exact Question We want to know the amount of child support, if any, that you think Dad should be required to pay Mom every month all things considered. What will change from story to story is how much Mom earns, and how much Dad earns. There is no right or wrong answer; just tell us what you think is right. Try to imagine yourself as the judge in each of the following cases. Picture yourself sitting on the bench in a courtroom needing to decide about what should be done about ordering child support in the case and trying to decide correctly. To do so, you might try putting yourself in the shoes of Mom or of Dad or both, or imagine a loved one in that position.
Respondents’ Average Support Function • Three lines, not 1—Mom’s income matters and POOI implicitly rejected • Rates on Dad’s income higher when Mom’s income lower Low income mom High Income mom
Lesson One • Respondents agree that as Mom’s $ ↓ • Dad should pay more in dollars, and • The rate applied to Dad’s income should go up • This is not POOI. • Is it Income Shares? • Do they believe Dad’s rate should go down as his income goes up? • No. See next chart
Support Payment as Percent of Dad’s Income Mom’s Income is $1,000 monthly
Support Payment as Percent of Dad’s Income Mom’s Income is $3,000 monthly
Support Payment as Percent of Dad’s Income Mom’s Income is $5,000 monthly
Key Points on Rates • Pima County citizens reject both POOI & Income Shares • They believe in a “flat tax” for child support • Income Shares Guidelines have a regressive rate structure • They believe the flat rate on Dad should be higher when Mom’s income is lower • This is not POOI either • This view about rate structure shared by men and women: no difference between them • But how does this translate to support $ ?
What About Other Income Share States? • Which one to pick? • Studies by Jane Venohr found that • There are 12 net income, income share states • Of these, Iowa had the median child support amounts • So, how do our respondents mean support amounts compare to the support levels required in Iowa?
Middle Cell: Identical • Top Row (Poor Moms): Public wants higher amounts • Bottom Row(Comfortable Moms) Public wants lower amounts
Key Points on Amounts • Respondents generally favor amounts higher than Arizona guidelines • Compared to Iowa they want • Higher amounts for low-income CPs • Lower amounts for high-income CPs • This follows from Well-Being and EPP principles, consistent with Dual Obligation • We must ask about higher NCP to find out about Gross Disparity • Men and Women agree on this rate structure • But do they agree about amounts?
Mom has $5000 Mom has $1000 Mom has $3000
Further Data On the Way • Two children, higher incomes for NCP • Gender reversals • Attitudes about support principles and how they relate to support amounts • Are amounts affected by whether the parents were married, or the length of their relationship • Impact of visitation arrangements on amounts • Impact of visitation frustration on support amounts • Anchoring Effects: a possible way to tame gender differences • Impact of Showing subjects the parties’ post-transfer incomes